
Semiconductor Physics and P-N Junction Devices
Master the fundamentals of intrinsic and extrinsic semiconductors, derive carrier concentrations and Fermi levels, and analyze p-n junction diode characteristics under equilibrium, forward, and reverse bias conditions.
Before you start: Basic quantum mechanics and statistical distributions; Solid-state energy bands and thermal physics.
Your path through this module
- Introduction to Energy Bands in Solids: Electrons in closely packed solid atoms occupy allowed energy bands separated by forbidden energy gaps.
- Intrinsic Semiconductors and Electron Concentration: Integration of the density of states and the Fermi distribution yields the conduction band electron concentration.
- Intrinsic Carrier Concentration and Fermi Level: The intrinsic carrier concentration depends exponentially on the band gap, and the Fermi level lies exactly midway between bands at zero Kelvin.
- Extrinsic Semiconductors and Doping: Pentavalent and trivalent dopants create donor and acceptor energy levels, shifting the Fermi level and making one carrier type dominant.
- P-N Junction Formation and Energy Bands: Carrier diffusion creates a space-charge depletion region and a built-in barrier potential that balances drift and diffusion currents at equilibrium.
- Diode Equation and V-I Characteristics: The diode current equation models exponential current growth under forward bias and a constant leakage current under reverse bias until breakdown.
Introduction to Energy Bands in Solids
Bridge and New Ideas
Having completed basic solid-state concepts, we examine how discrete atomic energy levels broaden into continuous bands. According to the Pauli exclusion principle, when isolated atoms are brought together to form a solid, their discrete orbital energy levels split and merge into continuous energy bands due to interatomic interactions.
Key Definitions
- Valence Band: The highest range of electron energies in which electrons are present at absolute zero (). Electrons in this band are typically bound to specific lattice sites or covalent bonds and do not contribute to electrical conduction.
- Conduction Band: The lowest range of vacant electronic energy levels located above the valence band. Electrons residing here are thermally or electrically excited, allowing them to move freely through the crystal lattice and conduct electricity.
- Forbidden Energy Gap (): An energy range between the valence band and the conduction band where no electron quantum states can exist. Its magnitude determines the electrical conductivity of the material.
Band Theory of Solids
The relationship between these bands dictates whether a material behaves as a conductor, semiconductor, or insulator. The energy gap is measured in electron-volts (), where .
| Material Type | Forbidden Gap () | Physical Behavior | Examples |
|---|---|---|---|
| Conductor | Valence and conduction bands overlap; free electrons available at all times. | Copper, Aluminum | |
| Semiconductor | Moderate () | Gap is narrow enough for thermal energy to excite electrons into the conduction band at room temperature. | Silicon, Germanium |
| Insulator | Large () | Gap is too large for thermal excitation; requires immense electric fields to conduct. | Diamond, Quartz |
Worked Example
Problem: At room temperature, silicon has a forbidden energy gap . Express this energy gap in Joules.
Solution:
- Identify the conversion factor: .
- Multiply the given energy gap by the conversion factor: [E_g = 1.1\text{ eV} \times 1.602 \times 10^{-19}\text{ J/eV} = 1.762 \times 10^{-19}\text{ J}]
Remember
- Atomic energy levels broaden into continuous allowed bands in a solid.
- The valence band holds bound electrons, while the conduction band enables electrical transport.
- The forbidden energy gap () separates these two bands and dictates material class (conductor, semiconductor, or insulator).
Intrinsic Semiconductors and Electron Concentration
Introduction to Semiconductors and Energy Bands
Semiconductors are materials whose electrical conductivity lies between that of insulators and conductors. They are broadly classified into intrinsic (pure) and extrinsic (doped) semiconductors. In a solid, atoms are closely packed, causing the discrete energy levels of electrons to interact and form continuous ranges of energy known as energy bands.
- Valence Band: The range of energy possessed by valence electrons.
- Conduction Band: The range of energy possessed by free electrons responsible for electrical conduction.
- Forbidden Energy Gap (): The energy separation between the valence band and the conduction band where no allowed electron energy states exist. For insulators , for conductors the bands overlap (), and for semiconductors .
Intrinsic Semiconductors
Pure semiconductors without any intentional impurity additions are called intrinsic semiconductors (e.g., Silicon and Germanium). When an electric field is applied, free electrons in the conduction band accelerate toward the positive terminal while holes migrate toward the negative terminal, constituting the semiconductor current.
Properties of Intrinsic Semiconductors
- Low Conductivity: Limited intrinsic charge carriers yield relatively low electrical conductivity at room temperature.
- Equal Carrier Concentrations: The number of conduction band electrons equals the valence band hole concentration: where is electron concentration and is hole concentration.
- Temperature Dependence: Conductivity increases exponentially with temperature due to thermally generated electron-hole pairs.
- Crystalline Structure: Possess a well-defined periodic crystal lattice.
- Band Gap Energy: Characteristic determines optical absorption and emission spectra.
- Sensitivity to Impurities: Electrical properties alter drastically with trace impurity additions.
Derivation of Electron Concentration in the Conduction Band
The total density of electrons in the conduction band () is determined by integrating the product of the density of available energy states and the Fermi-Dirac probability function over all conduction band energies starting from the bottom of the conduction band ().
Let be the number of electrons per unit volume in the energy range and :
From quantum statistical mechanics, the density of states in the conduction band is given by: where is the effective mass of the electron in the conduction band, is Planck's constant, and is the bottom edge energy of the conduction band.
The Fermi-Dirac distribution function representing the probability of electron occupancy at energy level is: where is the Fermi energy level, is the Boltzmann constant, and is the absolute temperature.
For energy states in the conduction band, for all practical temperatures . Therefore, , allowing us to neglect in the denominator of equation (4):
Substituting equations (3) and (5) into equation (1):
Integrating from the bottom of the conduction band to the top ():
Using the substitution , so that , . When , ; when , :
Evaluating the standard definite integral :
Letting as the effective density of states in the conduction band, the electron concentration simplifies to:
Similarly, the expression for the density of holes in the valence band of an intrinsic semiconductor is: where is the effective density of states in the valence band and is the top edge energy of the valence band.
Intrinsic Carrier Concentration and Fermi Level
Intrinsic Carrier Concentration ()
The number of electrons () in the conduction band, which equals the number of holes () in the valence band in a perfectly pure semiconductor material at a given temperature, is called the intrinsic carrier concentration ().
Using the equations for carrier concentrations:
Substituting the values of and into equation :
Since (the energy band gap):
Substituting the explicit expressions for the effective density of states and :
This is the complete expression for the intrinsic carrier concentration, where is the effective mass of electrons, is the effective mass of holes, is Boltzmann's constant, is Planck's constant, and is absolute temperature.
Variation of Intrinsic Carrier Concentration with Temperature
The temperature dependence of highlights key semiconductor behaviors:
- As temperature increases, increases exponentially because more thermal energy breaks covalent bonds, exciting electrons from the valence band to the conduction band.
- At a given temperature, materials with larger band gaps () exhibit lower intrinsic carrier concentrations because a higher energy threshold is required for excitation.
- Increased carrier concentrations at high temperatures cause larger leakage currents in semiconductor devices, which can degrade their thermal performance.
Important properties inferred from the equation include:
- The intrinsic concentration is independent of the Fermi level location.
- It has an exponential dependence on the band gap .
- It exhibits a strong dependence on absolute temperature .

Figure: PN junction diode formation and carrier diffusion
Schematic diagram depicting the formation of a p-n junction and its depletion region in two stages connected by a rightward transition arrow:
- Left diagram: Initial contact between a p-type semiconductor (labeled 'p' on top left) and an n-type semiconductor (labeled 'n' on top right), divided by a central vertical junction line. The p-region contains six negative acceptor ions (circles with '−') each accompanied by an open circle representing a hole. The n-region contains six positive donor ions (circles with '+') each accompanied by a solid dot representing an electron. Curved arrows indicate diffusion of electrons and holes across the junction.
- Right diagram: Equilibrium state showing the p-region (labeled 'p') and n-region (labeled 'n') with an established central depletion region bounded by vertical lines around the central junction. Inside the depletion layer, immobilized negative ions (column of three circled '−') exist on the p-side, and immobilized positive ions (column of three circled '+') exist on the n-side, devoid of free charge carriers. Outside the depletion region, mobile holes accompany the remaining negative ions in the p-side, and free electrons accompany the positive ions in the n-side.
Fermi Level and Fermi Energy
The Fermi level () is defined as the topmost filled energy level in a conductor at . For , the Fermi level represents the energy state at which the probability of occupation by an electron is exactly (or ).
The built-in barrier potential for silicon (Si) is and for germanium (Ge) is at equilibrium.
Fermi Level in an Intrinsic Semiconductor
In an intrinsic semiconductor, electron and hole concentrations are balanced:
Substituting the energy-band concentration formulas:
Simplifying and taking the natural logarithm to solve for :
At absolute zero (), assuming effective masses are comparable:
If the valence band edge is taken as the reference zero energy level:
Thus, in an intrinsic semiconductor, the Fermi level lies exactly in the middle of the forbidden energy band gap.
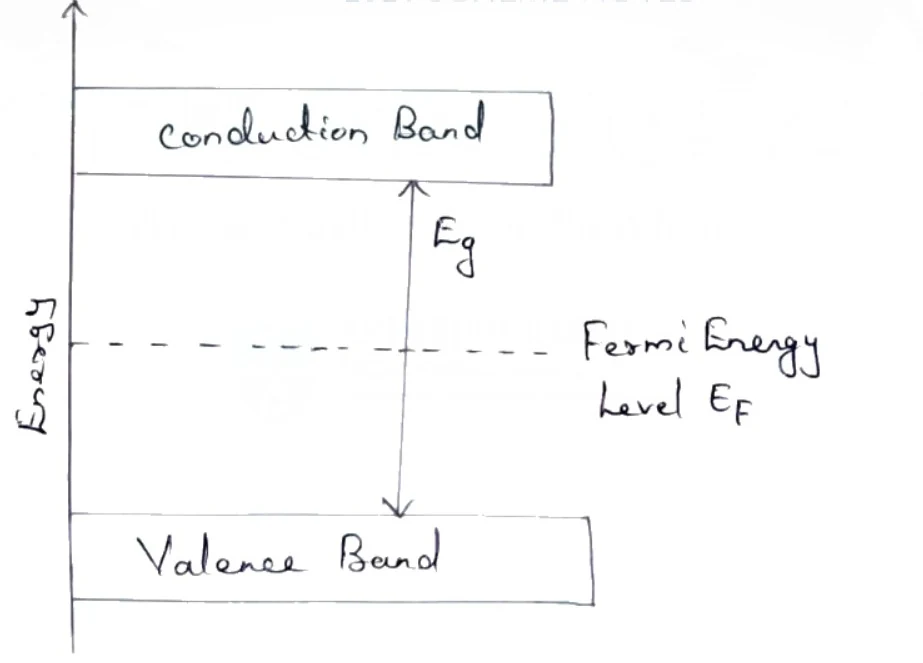
Figure: Energy band diagram showing Conduction Band, Valence Band, and Fermi Energy Level
Energy band diagram of an intrinsic semiconductor. A vertical axis pointing upwards on the left is labeled 'Energy'. Towards the top, a horizontal rectangular box is labeled 'Conduction Band'. Towards the bottom, a horizontal rectangular box is labeled 'Valence Band'. A vertical double-headed arrow between the top edge of the Valence Band and the bottom edge of the Conduction Band indicates the band gap, labeled 'E_g'. Exactly halfway between the Valence Band and Conduction Band, a horizontal dashed line extends across, labeled to its right as 'Fermi Energy Level E_F'.
Extrinsic Semiconductors and Doping
With intrinsic properties established, we introduce impurity doping to control carrier density and conductivity. The conductivity of an intrinsic semiconductor can be significantly altered by the addition of impurities. This process is called doping and the impurities added are called dopants. A semiconductor which has undergone doping is called extrinsic semiconductor. They are of two types: n-type and p-type.
1) n-type Semiconductor
When an intrinsic semiconductor is doped with pentavalent impurities like phosphorus, arsenic, or antimony, free electrons are generated, thereby making the electrons the majority carriers. Holes become the minority carriers and the Fermi level shifts towards the conduction band.
Examples:
- Silicon doped with Phosphorus
- Germanium doped with Arsenic
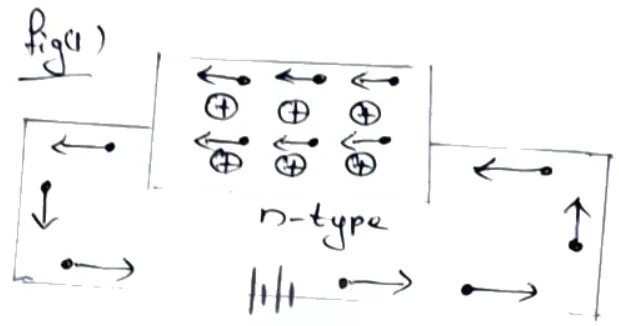
Figure: Diagram of n-type semiconductor with charge carriers
Schematic diagram of an n-type semiconductor connected in an external circuit, labelled 'fig(1)' and 'n-type Semiconductor' to the right. The semiconductor block is shown horizontally with a label 'n-type' in the center. Inside the block are six donor ions represented as circles with plus signs inside, arranged in two rows of three. Above the donor ions are arrows pointing to the left representing electron flow. The block is connected to an external circuit with a DC battery at the bottom consisting of four alternating long and short plates (negative on left, positive on right or vice versa). Directional arrows in the external loop show current/electron movement: on the left vertical segment, an arrow points downward; along the bottom wire, arrows point rightward on either side of the battery; on the right vertical segment, an arrow points upward; along the upper horizontal leads, arrows point leftward.
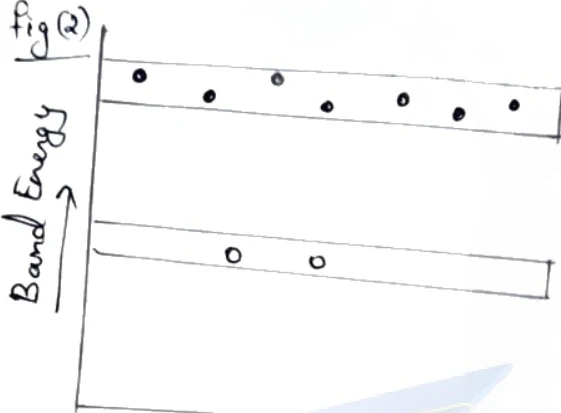
Figure: Energy band diagram of an n-type semiconductor
Energy band diagram of an n-type semiconductor labelled 'fig(2)'. A vertical axis on the left with an upward arrow is labelled 'Band Energy'. The diagram shows two horizontal rectangular bands: an upper band labelled 'Conduction Band' containing seven solid dots representing electrons, and a lower band labelled 'Valence Band' containing two hollow circles representing holes. Accompanying text below reads: 'Energy band description of n-type semiconductor is shown in fig(2)'.
2) p-type Semiconductor
When an intrinsic semiconductor is doped with trivalent impurities like boron, aluminium, or gallium, holes are generated, thereby making the holes the majority carriers. Electrons become the minority carriers and the Fermi level shifts towards the valence band.
Examples:
- Silicon doped with Boron
- Germanium doped with Aluminium
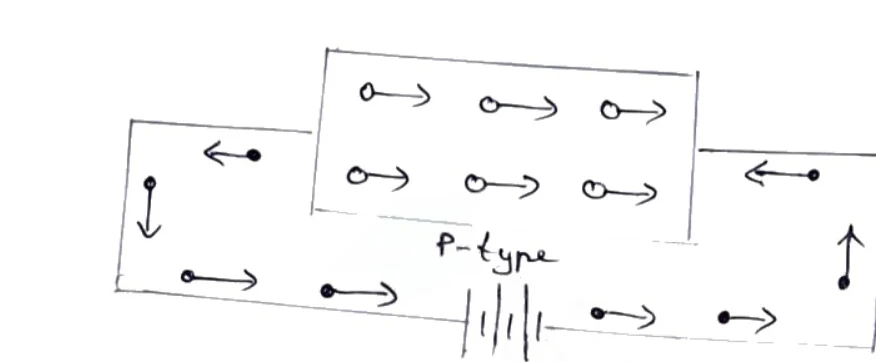
Figure: Fig: 1 p-type semiconductor
Schematic diagram titled 'Fig: 1 p-type semiconductor' showing charge carrier conduction in a p-type semiconductor connected to an external battery. The central rectangular block is labelled 'p-type' below it. Inside this block are two rows of three hollow circles (representing holes) each with an arrow pointing to the right (→). Below the block, an electrical circuit contains a multi-cell DC battery symbol. In the external circuit, conduction by electrons is indicated by solid dots with arrows: two dots with right-pointing arrows (→) to the left of the battery, and two dots with right-pointing arrows (→) to the right of the battery. Flanking the semiconductor block are additional arrows representing current/electron flow: on the upper left, a left-pointing arrow with a dot; on the far left, a downward-pointing arrow; on the upper right, a left-pointing arrow with a dot; and on the far right, an upward-pointing arrow.
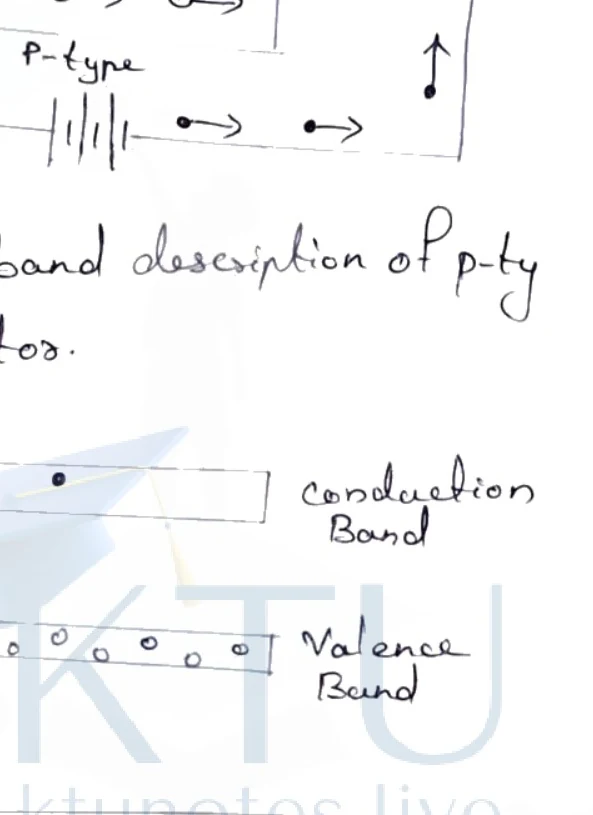
Figure: Fig: 2 Energy band description of p-type semiconductor
Energy band diagram titled 'Fig: 2 Energy band description of p-type semiconductor.' A vertical axis on the left is labelled 'Band Energy' with an upward-pointing arrow. Two horizontal rectangular strips represent the energy bands:
- The upper strip is labelled 'Conduction Band' and contains three solid black dots representing minority carrier electrons.
- The lower strip is labelled 'Valence Band' and contains nine hollow circles arranged along it, representing majority carrier holes.
Properties of Extrinsic Semiconductors
- Conductivity: The conductivity is high compared to intrinsic semiconductors due to an increased number of charge carriers.
- Charge Carriers: Depending on the type of dopants, the majority charge carriers may be electrons or holes.
- Position of the Fermi Level: For n-type semiconductors, the Fermi level shifts towards the conduction band, and for p-type semiconductors, it shifts towards the valence band.
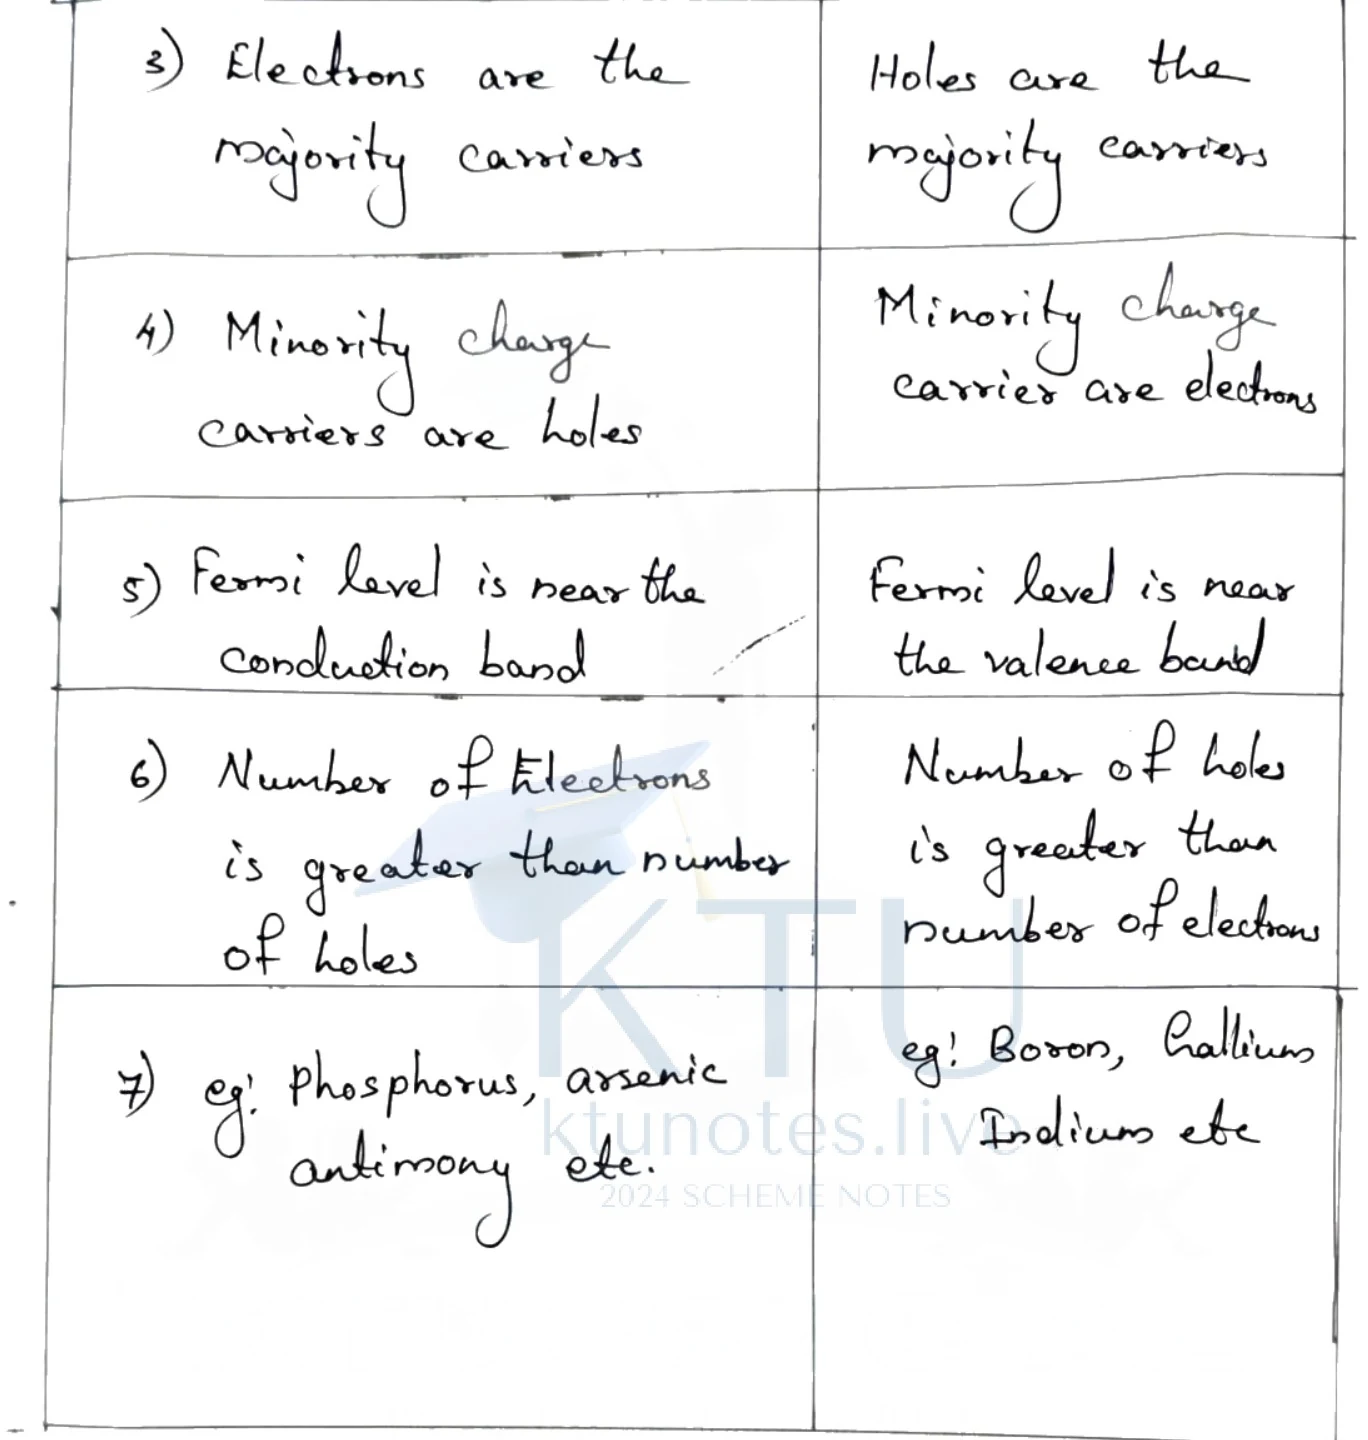
Figure: Comparison table of semiconductor properties
A handwritten comparison table with two main columns representing the differences between n-type semiconductor (left column) and p-type semiconductor (right column), containing points numbered 3 through 7:
- Row 3:
- Left: "3) Electrons are the majority carriers"
- Right: "Holes are the majority carriers"
- Row 4:
- Left: "4) Minority charge carriers are holes"
- Right: "Minority charge carrier are electrons"
- Row 5:
- Left: "5) Fermi level is near the conduction band"
- Right: "Fermi level is near the valence band"
- Row 6:
- Left: "6) Number of electrons is greater than number of holes"
- Right: "Number of holes is greater than number of electrons"
- Row 7:
- Left: "7) eg: phosphorus, arsenic antimony etc."
- Right: "eg: Boron, Gallium Indium etc"
Difference between N-type and P-type Semiconductors
| N-type | P-type |
|---|---|
| 1) When a pentavalent impurity is doped to an intrinsic semiconductor, an n-type semiconductor is formed. | When a trivalent impurity is doped to an intrinsic semiconductor, a p-type semiconductor is formed. |
| 2) The impurity is called donor impurity. | The impurity is called acceptor impurity since it accepts electrons. |
| 3) Electrons are the majority carriers. | Holes are the majority carriers. |
| 4) Minority charge carriers are holes. | Minority charge carriers are electrons. |
Difference between Intrinsic and Extrinsic Semiconductors
| Intrinsic Semiconductor | Extrinsic Semiconductor |
|---|---|
| 1) Semiconductor without doping. | Semiconductor with doping. |
| 2) Conductivity is low. | Conductivity is high. |
| 3) Number of free electrons is equal to the number of holes. () | Number of free electrons and number of holes are unequal. |
| 4) Conductivity depends only on temperature. | Conductivity depends both on temperature and the impurity added. |
| 5) Conductivity due to electrons and holes is nearly equal. | Conductivity is mainly due to majority charge carriers. |
| 6) It does not conduct at zero Kelvin. | It conducts at zero Kelvin. |
| 7) Fermi level lies in between valence and conduction bands. | Fermi level lies near the valence band in p-type and near the conduction band in n-type. |
| 8) Ratio of majority and minority carriers is unity. | Ratio of majority and minority carriers is not unity. |
| 9) e.g., Silicon, Germanium. | e.g., Silicon doped with phosphorus, Silicon doped with boron. |
P-N Junction Formation and Energy Bands
Bridge: Having studied separate semiconductor types, we investigate what happens when p-type and n-type materials are joined together.
The new idea: Carrier diffusion creates a space-charge depletion region and a built-in barrier potential that balances drift and diffusion currents at equilibrium.
Objectives
- Explain the formation of a p-n junction and depletion region.
- Analyze energy band diagrams under equilibrium, forward bias, and reverse bias.
Concepts and Definitions
- P-N Junction: The metallurgical interface formed by joining p-type and n-type semiconductor materials.
- Diffusion Current: Current caused by the concentration gradient of charge carriers, moving from high to low concentration regions.
- Drift Current: Current caused by the electric field in the depletion region sweeping minority carriers across the junction.
- Depletion Region (Space Charge Region): A zone near the junction nearly devoid of mobile charge carriers, leaving behind uncompensated immobile donor and acceptor ions.
- Built-in Potential () / Barrier Potential: The potential difference across the depletion region created by the unbalanced immobile ions.
- Forward Bias: An external voltage applied across the p-n junction that opposes the built-in potential, narrowing the depletion region and allowing large current flow.
- Reverse Bias: An external voltage applied in the same direction as the built-in potential, widening the depletion region and blocking majority carrier flow.
Formation of a P-N Junction
A p-n junction is formed by suitably joining a p-type semiconductor (majority holes) and an n-type semiconductor (majority electrons). Due to the large concentration gradient across the boundary, electrons from the n-side diffuse into the p-side, and holes from the p-side diffuse into the n-side. Near the interface, electrons and holes recombine, neutralizing each other.
This recombination leaves behind uncompensated immobile positive donor ions () on the n-side and negative acceptor ions () on the p-side. This uncharged region of fixed ions is called the depletion region. The accumulation of these charges sets up an internal electric field and a potential difference known as the built-in potential ().
The electric field creates a drift current of minority carriers that opposes the initial diffusion current. Equilibrium is reached when the diffusion current equals the drift current, resulting in a net current of zero.
Energy Band Diagrams: Equilibrium, Forward Bias, and Reverse Bias
i) Equilibrium Condition
Under equilibrium (zero external voltage), the Fermi level across the p-n junction remains constant. The conduction band and valence band bend upward from the p-side to the n-side by an energy amount equal to , where is the electronic charge and is the built-in potential. This band bending creates a potential barrier that prevents further net diffusion of majority carriers.
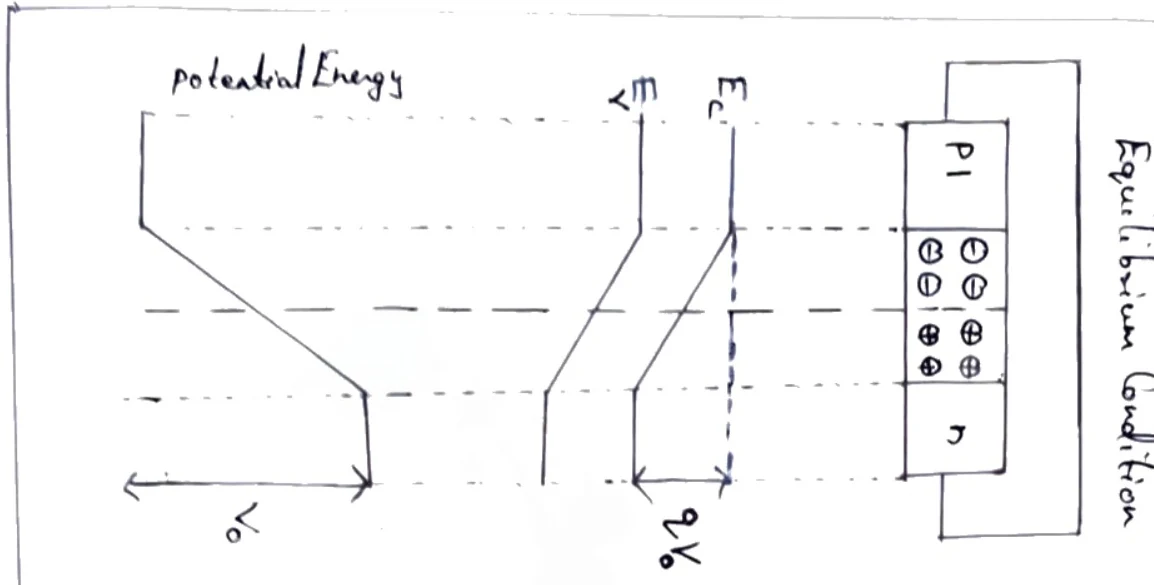
Figure: Energy band diagram under equilibrium condition
Energy band diagram of a p-n junction under 'Equilibrium Condition'. The diagram is divided into three vertically aligned sections by dashed lines indicating the depletion layer boundaries and the junction interface: 1) Physical junction diagram: A rectangular semiconductor block with regions 'P' on the left and 'n' on the right, connected externally by a short-circuit wire. Across the central junction, the depletion layer contains fixed ionized acceptors (two columns of two '⊖' symbols) in the P-side and fixed ionized donors (two columns of two '⊕' symbols) in the n-side. 2) Energy band diagram: Shows conduction band edge '' and valence band edge ''. Both bands are flat in the neutral P-region, bend smoothly downward across the depletion region, and become flat again in the neutral n-region. The total band bending (energy barrier) between the P-side and n-side conduction band edges is indicated by dashed horizontal alignment lines and labeled ''. 3) Potential energy diagram: Labeled 'potential Energy' along the vertical axis, showing an energy profile that starts high in the P-region, slopes downward across the depletion region, and flattens out lower in the n-region, with a total step height labeled '' (built-in potential).
Figure: Energy band diagram and physical junction of a p-n junction under equilibrium condition, showing the depletion layer boundaries and built-in potential energy barrier.
ii) Forward Bias Condition
When a positive external DC voltage is applied to the p-type region relative to the n-type region, the external electric field opposes the built-in potential. Consequently, the effective potential barrier is reduced from to , where is the applied forward voltage. This causes the depletion region to narrow, allowing majority carriers to easily cross the junction, recombine, and generate a large forward current.

Figure: Energy band diagram under forward bias
Energy band diagram of a p-n junction under 'Forward Bias'. Structured into three vertically aligned sections: 1) Physical junction diagram: A semiconductor block with 'P' region connected to the positive terminal (long line) and 'n' region connected to the negative terminal (short line) of an external DC voltage source. The depletion layer is narrower than in equilibrium, containing only one column of two '⊖' ions on the P-side and one column of two '⊕' ions on the n-side. 2) Energy band diagram: Bands '' and '' bend downward across the narrowed depletion region from P to n. The barrier height is reduced compared to equilibrium, labeled '' between the horizontal levels of the conduction band edge on the P-side and n-side. 3) Potential energy diagram: Shows a potential barrier across the narrowed depletion layer with a reduced height difference labeled ''.
Figure: Energy band diagram under forward bias, showing the narrowed depletion region, reduced potential barrier height, and forward connection polarity.
iii) Reverse Bias Condition
When a negative external DC voltage is applied to the p-type region relative to the n-type, the external voltage adds to the built-in potential. The potential barrier increases to , where is the reverse voltage. This widens the depletion region, preventing majority carriers from crossing. Only a very small reverse saturation current flows due to thermally generated minority carriers sweeping across the junction.
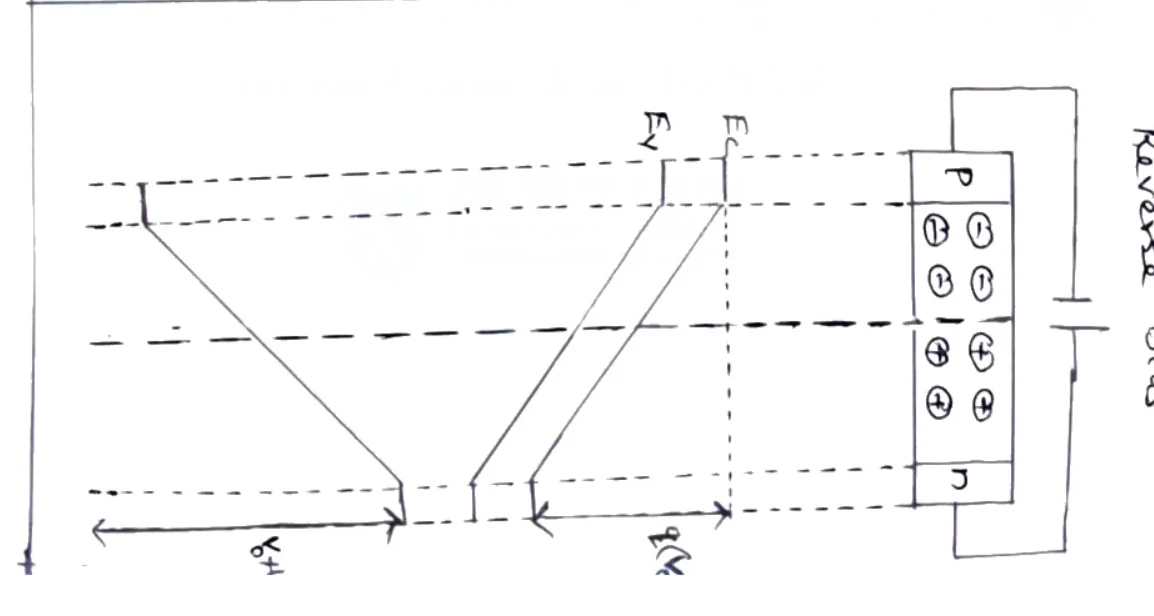
Figure: Energy band diagram under reverse bias
Energy band diagram of a p-n junction under 'Reverse Bias'. Structured into three vertically aligned sections: 1) Physical junction diagram: The 'P' region is connected to the negative terminal (short line) and the 'n' region is connected to the positive terminal (long line) of an external DC voltage source. The depletion region is noticeably wider than in equilibrium, containing three columns of two fixed negative ions ('⊖') on the P-side and three columns of two fixed positive ions ('⊕') on the n-side. 2) Energy band diagram: Conduction band '' and valence band '' undergo a much steeper and larger downward bending across the widened depletion layer; the increased energy barrier height is labeled with '' (partially visible as ''). 3) Potential energy diagram: Shows a large downward potential step across the widened depletion layer, with the total potential height difference labeled '' (partially visible as '').
Figure: Energy band diagram under reverse bias, showing the widened depletion region, increased potential barrier height, and reverse connection polarity.
Summary of Key Relations
- Built-in Potential Barrier:
- Forward Bias Barrier Height:
- Reverse Bias Barrier Height:
Diode Equation and V-I Characteristics
Diode Current Equation Derivation
The diode current equation mathematically relates the net current flowing through a p-n junction diode to the external applied voltage. The total diode current is composed of the sum of the hole current and the electron current crossing the depletion region:
The hole current is proportional to the excess change in minority hole density in the n-region (), and the electron current is proportional to the excess change in minority electron density in the p-region ().
According to the Boltzmann relation, the equilibrium hole density in the p-region is given by:
where is the barrier potential across the depletion layer, and is the voltage equivalent of temperature defined as:
At room temperature (), the thermal voltage evaluates to:
Under unbiased conditions, the barrier potential equals the built-in potential (). Equation (1) becomes:
When a forward bias voltage is applied, the effective barrier potential decreases to . The injected minority hole density in the n-region increases from to . Rewriting the Boltzmann relation for the forward-biased condition:
Equating the expressions for from Equations (2) and (3):
Solving for the excess minority carrier concentration :
Using Equation (2), we substitute -side equilibrium density as into Equation (4):
Since hole current :
where is a proportionality constant. Similarly, the electron current is:
Combining both components yields the total diode current:
where is the reverse saturation current, which is heavily temperature-dependent. Accounting for material imperfections and recombination effects, the practical diode current equation includes the material constant :
where for Germanium and for Silicon.
V-I Characteristics of a P-N Junction
The V-I characteristics graphically display the current response of a p-n junction diode under varying external terminal voltages. The voltage is plotted along the abscissa (x-axis) and the current along the ordinate (y-axis).
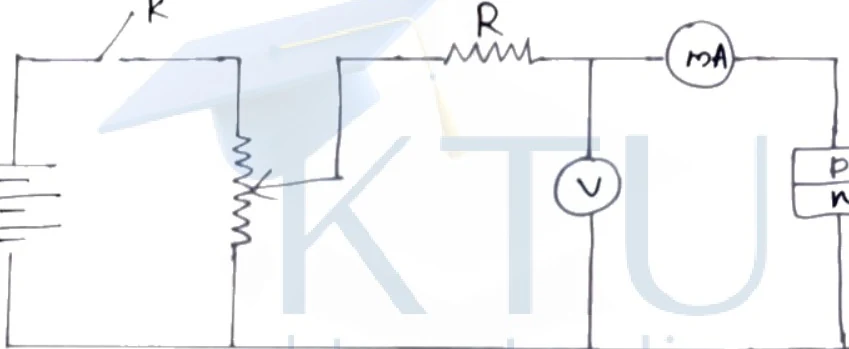
Figure: Circuit diagram for studying VI characteristics of p-n junction
Circuit diagram for studying the V-I characteristics of a p-n junction diode in forward bias. A DC battery source (with 4 pairs of long and short plates, positive terminal on top) is connected in series with an open key labeled 'K' on the top rail. Following key K, a potential divider (vertical zigzag resistor) is connected across the rails. A variable slider contact (wiper arrow) from the potential divider leads to a series resistor labeled 'R'. After resistor R, the line splits into two parallel branches: a vertical branch containing a voltmeter represented by a circle with 'V', connected between this node and the bottom return rail; and the continuation of the top rail which passes through a milliammeter represented by a circle with 'mA'. Following the milliammeter, the circuit connects to a p-n junction diode represented as a vertically stacked rectangular box divided into two compartments labeled 'p' (top) and 'n' (bottom). The bottom 'n' terminal of the diode connects to the common bottom return wire, which connects back to the negative terminal of the battery.
Circuit diagram for studying the V-I characteristics of a p-n junction diode in forward bias. A DC battery source is connected in series with an open key labeled 'K'. A potential divider potentiometer circuit supplies a variable forward bias voltage across the diode.
The operation divides into three distinct regions:
-
Zero Bias (No Bias) Region: When the external voltage is zero (key open), the internal barrier potential prevents net carrier flow. The net circuit current is zero, corresponding to the origin in the characteristic curves.
-
Forward Bias Region: The p-n junction is connected with positive terminal to the p-type and negative to the n-type. The external field opposes and reduces the internal barrier potential. Initially, current grows very slowly (region OA) as voltage is consumed overcoming the potential barrier. Once the applied voltage exceeds the knee voltage, current increases exponentially and rapidly (region AB), and the diode operates as a normal low-resistance conductor. This region is utilized for rectification and signal amplification.
-
Reverse Bias Region: The p-n junction is connected with negative terminal to the p-type and positive to the n-type. The barrier potential and depletion width increase. Only a minuscule reverse saturation current () flows due to thermally generated minority carriers (region OC). If the reverse voltage is raised excessively, high-energy minority carriers induce impact ionization, causing an avalanche breakdown where current surges and resistance drops abruptly.
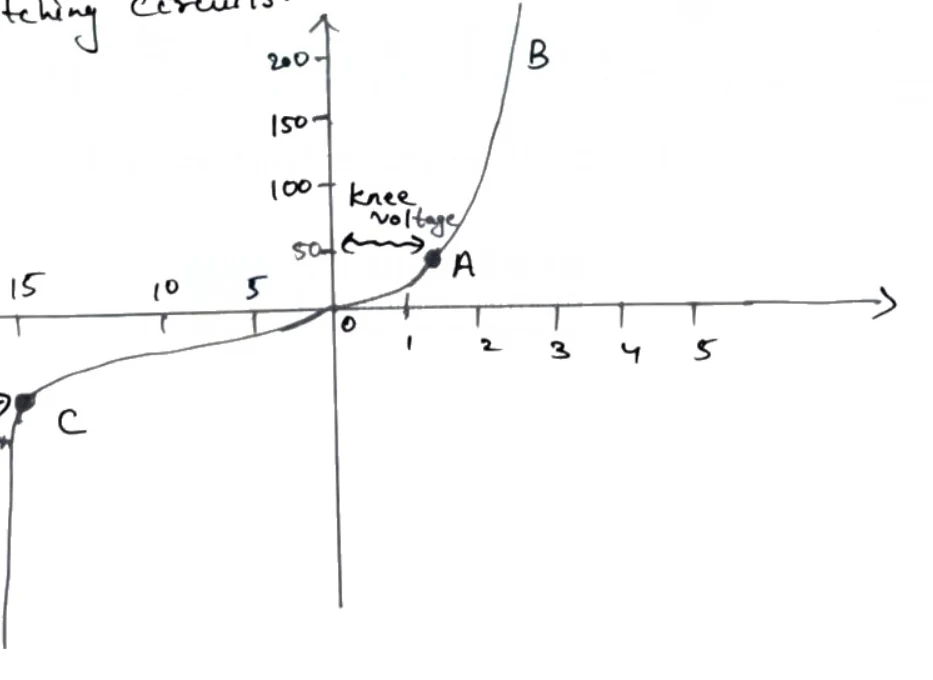
Figure: Reverse bias V-I characteristic graph showing knee voltage, point A, B, and breakdown voltage at point C.
V-I characteristic curve of a p-n junction diode plotted on a Cartesian coordinate system. The horizontal axis (voltage) has origin '0', positive tick marks at 1, 2, 3, 4, 5 to the right with an arrowhead at the right end, and negative tick marks at 5, 10, 15 to the left. The vertical axis (current) has an upward arrowhead and tick marks at 50, 100, 150, 200 above the origin. In the first quadrant (forward bias), the curve starts at 0, remains nearly flat along the horizontal axis, bends upwards at a dot labeled 'A' (near V = 1), and rises steeply through point 'B' past 200. A horizontal double-headed arrow above the curve between the vertical axis and point A is labeled 'knee voltage'. In the third quadrant (reverse bias), the curve extends from origin '0' with a small downward offset (reverse saturation current OC) towards a solid dot labeled 'C' located below the negative horizontal axis (near reverse voltage 15). From point 'C', the curve drops sharply downwards, with an arrow pointing to point C labeled 'Breakdown voltage'.
Reverse bias V-I characteristic graph showing knee voltage, point A, B, and breakdown voltage at point C.
Important Diode Terminology
- Thermal Voltage (): The voltage equivalent of temperature, equal to (approx. at ). It scales the exponential voltage dependence of current.
- Reverse Saturation Current (): A tiny leakage current flowing under reverse bias caused by minority carrier drift across the depletion region. It is independent of applied reverse voltage but highly sensitive to temperature.
- Knee Voltage: The minimum forward bias voltage required to cause a sharp, exponential rise in diode current. Width of the depletion layer decreases when the knee voltage increases. Typical values are for Germanium and for Silicon.
- Peak Inverse Voltage (PIV) / Breakdown Voltage: The maximum reverse voltage a diode can withstand without experiencing non-destructive or destructive junction breakdown. PIV is for Germanium and for Silicon.