
Semester 1 Engineering Physics: Semiconductor and Photonic Devices
Master the fundamentals, operation, efficiency, and characteristics of semiconductor rectifiers, Zener diodes, tunnel diodes, photodiodes, solar cells, and light-emitting diodes.
Before you start: Basic electronics and atomic structure; P-N junction diode forward and reverse biasing; Fundamental electricity and power formulas.
Your path through this module
- Introduction to Rectifiers and Half-Wave Rectifiers: A single diode can half-wave rectify AC into pulsating DC with a maximum theoretical efficiency of 40.6%.
- Full-Wave Rectifiers and Ripple Factor: Using two or four diodes in bridge configurations doubles the output power efficiency to 81.2% and significantly reduces the ripple factor.
- Zener Diode and Breakdown Mechanisms: Heavy doping creates a thin depletion layer where high electric fields cause Zener breakdown at precise low voltages, enabling constant voltage regulation.
- Tunnel Diodes and Negative Resistance: Extreme doping allows electrons to tunnel through the barrier directly, creating a negative resistance region used in ultra-high speed switching and oscillators.
- Photodetectors: Junction and PIN Photodiodes: Inserting an intrinsic region between heavily doped p and n layers in a PIN photodiode broadens the space charge area, maximizing photon absorption and speed.
- Solar Cells and Panel Stringing: Solar cells convert solar radiation directly into electrical power under zero bias, and cells can be strung in series or parallel to scale total voltage or current.
- Light Emitting Diodes (LEDs): Forward-biasing a heavily doped p-n junction forces electron-hole recombination that releases energy as photons, where the color is determined by the semiconductor band gap energy.
Introduction to Rectifiers and Half-Wave Rectifiers
Introduction and Rectification
Having studied basic p-n junctions, we now explore how they convert alternating current (AC) into direct current (DC). A rectifier is an electronic device that converts an alternating current into a direct current by using one or more P-N junction diodes. The process of converting AC to DC is called rectification.
Rectifiers are generally classified into two basic types:
- Half-wave rectifier
- Full-wave rectifier
Half-Wave Rectifier
A half-wave rectifier is a type of rectifier that converts only half of the input AC signal into a pulsating DC output signal, while the remaining half of the signal is blocked or lost. In a half-wave rectifier, a single p-n junction diode is connected in series with a load resistor and an AC supply (typically fed via a step-up or step-down transformer).
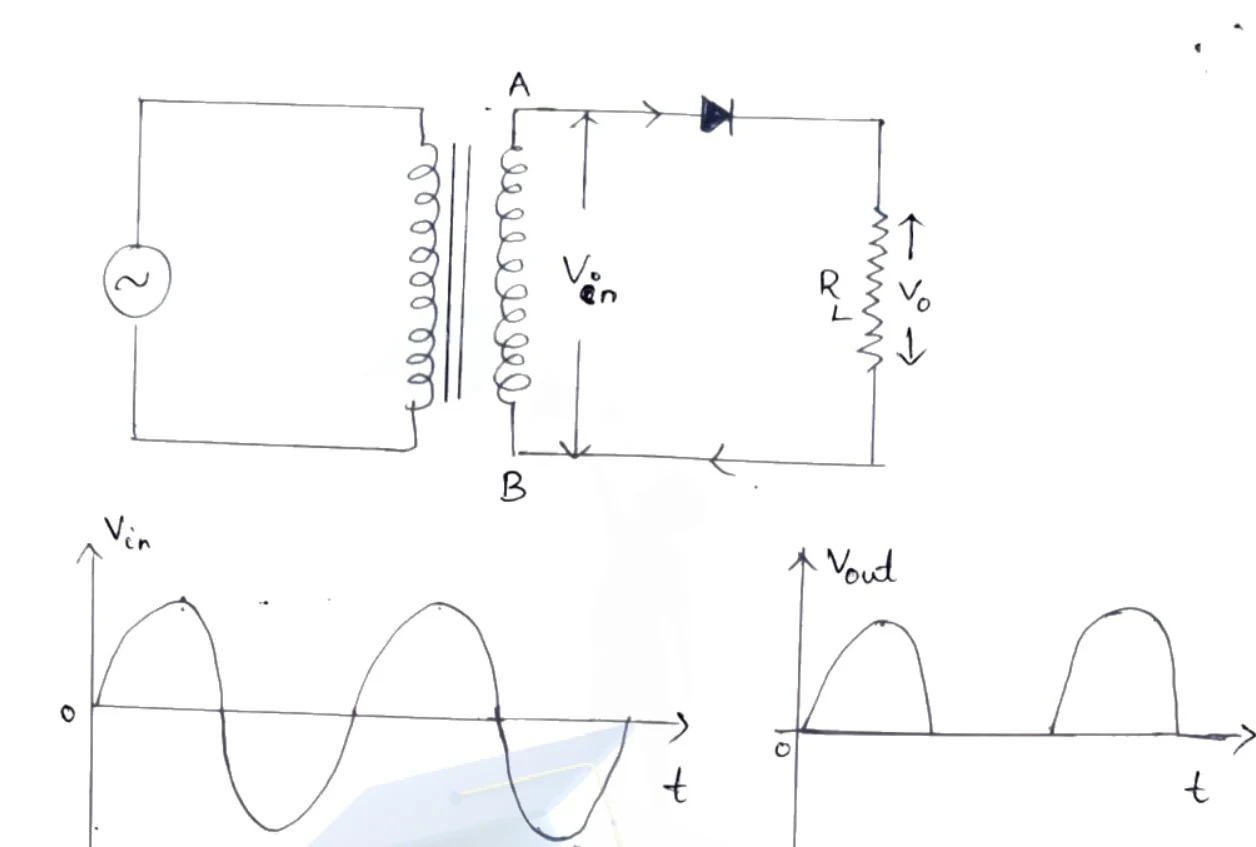
Figure: Half wave rectifier circuit diagram and input-output waveforms
Half wave rectifier circuit diagram and input-output waveforms. The top shows a transformer with a primary winding connected to an AC voltage source (indicated by a circle with a sine wave symbol) and a secondary winding connected between terminals A and B, with AC voltage V_in across them. Terminal A connects in series with a diode pointing right and a load resistor R_L, with output voltage V_o (or V_out) across it. Arrows indicate current direction. Below the circuit are two waveform graphs with axes labelled t and V_in or V_out: the input voltage graph shows a complete sinusoidal wave against time t, and the output voltage graph shows only the positive half-cycles of the sine wave against time t.
Working Principle
- Positive Half Cycle: The AC voltage across the secondary winding changes polarities. During the positive half-cycle, terminal becomes positive with respect to terminal . This makes the diode forward-biased, allowing it to conduct current through the circuit and the load resistor .
- Negative Half Cycle: During the negative half-cycle, terminal is negative with respect to terminal . This makes the diode reverse-biased, blocking the flow of current.
Consequently, all negative half-cycles of the AC supply are suppressed, and current flows through the load in only one direction, creating a pulsating DC voltage. This pulsating output can be smoothened out using a filter circuit.
Peak Inverse Voltage (PIV)
Peak Inverse Voltage is the maximum voltage that a diode must withstand when it is reverse-biased. For a half-wave rectifier, the PIV is equal to the maximum voltage across the entire secondary winding: where is the maximum peak voltage across half of the secondary winding.
Disadvantages of Half-Wave Rectifiers
- The output is very low since power is delivered to the load only during half of the input cycle.
- Heavy filtering is required to produce a steady DC current due to high ripple content.
Efficiency of a Half-Wave Rectifier
Rectifier efficiency () is defined as the ratio of the DC power output to the applied input AC power:
Derivation of Efficiency
-
DC Output Power (): Since the DC load current for a half-wave rectifier is (where is the maximum peak value of current):
-
AC Input Power (): Since the RMS current for a half-wave rectifier is :
-
Calculating Efficiency ():
where:
- = Load resistance
- = Forward resistance of the diode
The efficiency of a half-wave rectifier is maximum when the diode forward resistance is negligible compared to the load resistance .
Full-Wave Rectifier Preview
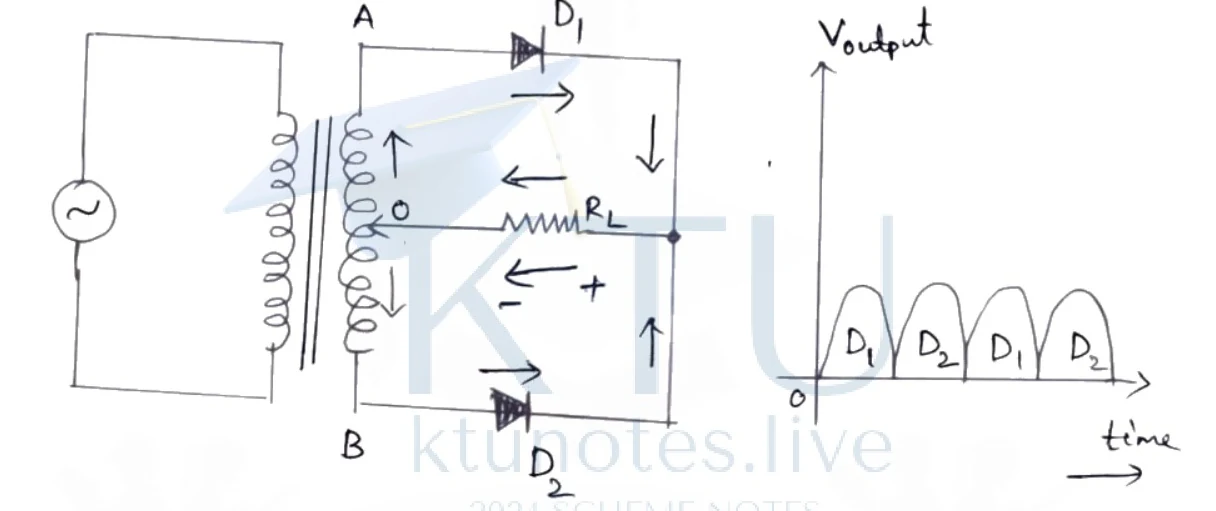
Figure: Centre tap full wave rectifier circuit diagram and output waveform
Centre tap full wave rectifier circuit diagram and output waveform. A circuit diagram showing an AC source connected to the primary winding of a transformer. The secondary winding AB has a centre tap O. Diode D1 is connected in series with terminal A, and diode D2 is connected in series with terminal B. Both diodes feed into a common load resistor RL that is connected back to the centre tap O. Arrows show the direction of current flow. To the right, a graph of Voutput versus time shows a rectified pulsating DC waveform consisting of a sequence of positive half-sine waves labelled alternately D1, D2, D1, D2.
In a centre-tap full-wave rectifier, two diodes ( and ) and a centre-tapped transformer are used to achieve rectification during both the positive and negative half-cycles, effectively doubling efficiency and output power.
Full-Wave Rectifiers and Ripple Factor
While a half-wave rectifier uses only one half of the alternating current (AC) input cycle, a full-wave rectifier utilizes both halves to achieve higher efficiency and a smoother output. This section covers the operation of centre-tap and full-wave bridge rectifiers, their mathematical efficiency, and the ripple factor.
Centre-Tap Full-Wave Rectifier
A centre-tap full-wave rectifier uses a transformer with a tapped secondary winding connected to two diodes ( and ) and a shared load resistor .
- Positive Half Cycle: End of the secondary winding becomes positive and end becomes negative. Diode is forward-biased and conducts, while is reverse-biased and blocks current. Conventional current flows through , the load resistor , and the upper half of the secondary winding.
- Negative Half Cycle: End becomes negative and end becomes positive. Diode conducts, while is reverse-biased. Current flows through , the load resistance , and the lower half of the winding.
Because the current flows through the load resistance in the same direction during both half-cycles, continuous unidirectional pulsating DC is obtained. The peak inverse voltage (PIV) across each diode is: where is the maximum secondary voltage.
Disadvantages of Centre-Tap Rectifier:
- It is difficult and expensive to locate the exact centre tap on the secondary winding.
- The diodes used must withstand a high peak inverse voltage ().
- The DC output voltage is relatively small.
Full-Wave Bridge Rectifier
To overcome the limitations of the centre-tap configuration, the bridge rectifier uses four diodes without requiring a centre-tapped transformer.

Figure: Full wave bridge rectifier circuit diagram
Full wave bridge rectifier circuit diagram. A circuit diagram showing an AC input connected to the primary winding of a transformer. The secondary winding has terminals P and Q. Terminal P connects to a bridge network of four diodes (D1, D2, D3, D4). Between the input junctions A and B of the bridge, a load resistor RL is connected with polarity minus at the top and plus at the bottom, leading to ground. Ground symbol is also connected between diodes D1 and D2 at node A.
Figure 1: Full wave bridge rectifier circuit diagram

Figure: Secondary voltage waveform
Secondary voltage waveform. A sinusoidal voltage waveform plot with axes Vo versus t. The sine wave shows positive and negative alternating half cycles, with an arrow pointing to the wave labelled secondary voltage.
Figure 2: Secondary voltage waveform
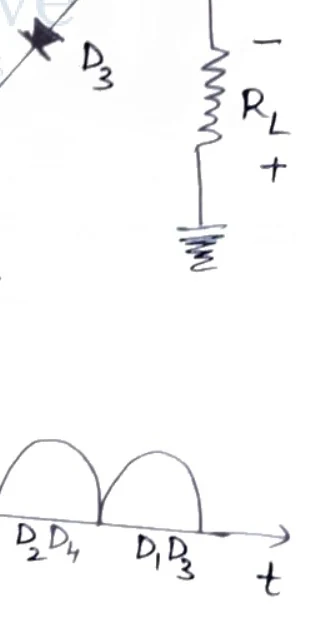
Figure: Output voltage waveform Vout
Output voltage waveform Vout. A rectified full wave output waveform plot with axes Vout versus t. It shows pulsating positive half-cycles. Below the respective crests are labels indicating conducting diodes: D1 D3, then D2 D4, then D1 D3.
Figure 3: Output voltage waveform Vout
Working Principle
In a full-wave bridge rectifier, four diodes ( and ) are arranged in a bridge network. The AC supply is applied to diagonally opposite ends via a transformer, and the load resistance is connected across the remaining two terminals.
- Positive Half Cycle: End of the secondary winding is positive and end is negative. Diodes and become forward-biased and conduct in series through the load , while and are reverse-biased. Current flows from terminal to through .
- Negative Half Cycle: End becomes negative and end becomes positive. Diodes and become forward-biased and conduct through the load resistance , while and are reverse-biased. Current flows through in the exact same direction ( to ) as during the positive half cycle.
Advantages and Disadvantages
Advantages:
- No centre-tapped transformer is required.
- The peak inverse voltage (PIV) is halved to , compared to in the centre-tap circuit.
- The DC output is twice that of the single-diode half-wave configuration.
Disadvantages:
- It requires four diodes instead of two.
- The internal voltage drop is twice that of the centre-tap circuit because two diodes conduct in series during each half cycle.
Efficiency of a Full-Wave Rectifier
Rectifier efficiency () is defined as the ratio of the DC power output to the applied AC power input:
The DC power delivered to the load resistor is: where is the average DC load current and is the peak load current.
The total AC input power consumed by the circuit is: where the RMS load current for a full-wave rectifier is , and is the forward resistance of the diodes. Substituting :
Dividing by gives the efficiency equation:
Assuming the diode forward resistance is negligible compared to the load resistance ():
Ripple Factor
The ripple factor () measures the effectiveness of a rectifier and is defined as the ratio of the root-mean-square (rms) value of the AC component of the output to the DC component:
A smaller ripple factor indicates a weaker effective AC component (less pulsating noise) and a smoother DC output.
- Ripple Factor for Half-Wave Rectifier:
- Ripple Factor for Full-Wave Rectifier:
Preview: Zener Diode and Breakdown Mechanisms
A Zener diode is a heavily doped junction diode engineered to operate safely in the reverse breakdown region. Its precise breakdown voltage is established by regulating doping concentrations during manufacturing.
Zener Diode and Breakdown Mechanisms
Introduction and Construction
While standard p-n junction diodes are designed to block reverse current, heavily doped silicon p-n junction diodes called Zener diodes are specifically engineered to operate stably in the reverse breakdown region without getting damaged. Due to heavy doping concentration, the depletion region of a Zener diode is extremely thin. Consequently, a high electric field is established across the junction even at relatively low reverse voltages.

Figure: Symbol of zener diode
Symbol of zener diode. A standard diode symbol with a triangular anode pointing right, a vertical cathode line with bent tips pointing outwards at the top and bottom, and connecting horizontal lines on the left and right terminals. Text beside reads Symbol of zener diode.
Symbol of zener diode
The standard circuit symbol of a Zener diode is similar to that of a normal p-n junction diode, but with distinctive bent tips (resembling the letter 'Z') at the ends of the cathode bar.
Working Principle of Zener Diode
- Forward-Biased Condition: When the Zener diode is forward-biased, it behaves exactly like an ordinary p-n junction diode, allowing current to flow freely once the cut-in voltage (approx. for silicon) is exceeded.
- Reverse-Biased Condition: When reverse-biased, a very small leakage current (reverse saturation current) flows due to thermally generated minority carriers. As the reverse voltage is increased and reaches a critical value known as the Zener breakdown voltage (), the diode begins to conduct heavily. The reverse current increases sharply, but the voltage across the Zener terminals remains remarkably constant.
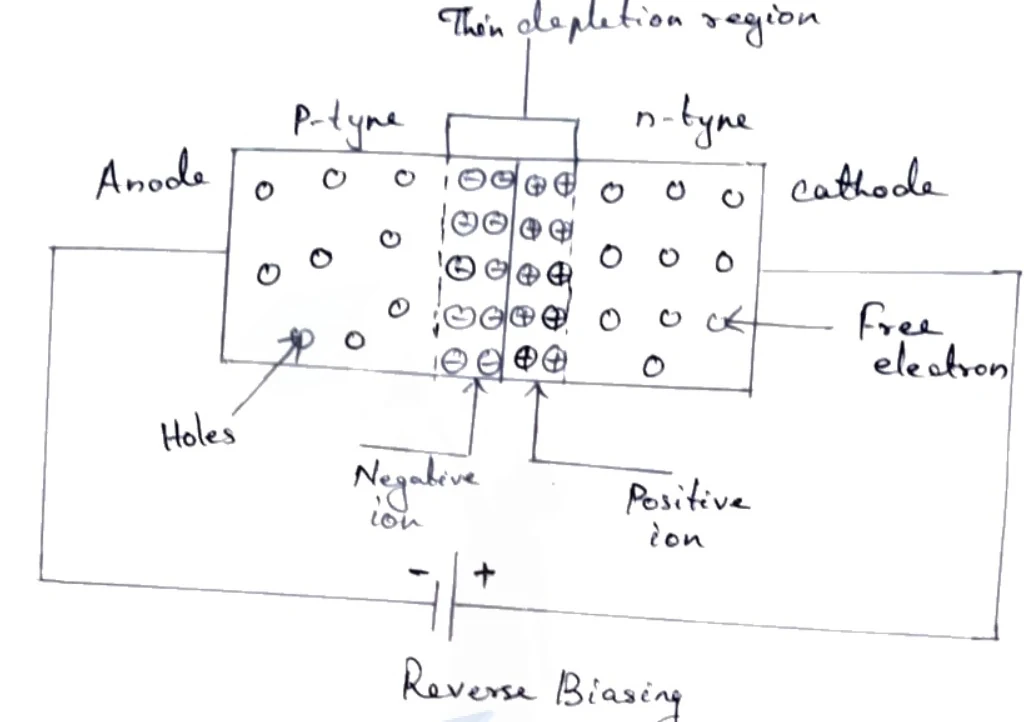
Figure: Diagram of a reverse-biased pn junction diode showing thin depletion region and circuit connections
Diagram of a reverse-biased pn-junction diode. The left side is labeled "p-type" and "Anode", showing holes represented as circles and negative ions with minus signs inside the central depletion region. The right side is labeled "n-type" and "cathode", showing free electrons represented as circles and positive ions with plus signs inside the central depletion region. A thin central vertical region is indicated by an arrow at the top labeled "Thin depletion region". Below the junction, arrows point to "Negative ion" and "Positive ion" respectively. A DC voltage source with a negative and a positive terminal symbol is connected across the anode and cathode in reverse bias. The entire diagram is labeled below as "Reverse Biasing".
Reverse Biasing
As the reverse voltage exceeds , the strong electric field across the narrow depletion region exerts a force sufficient to break covalent bonds, liberating electrons. These free electrons move from the valence band of the p-type semiconductor to the conduction band of the n-type semiconductor, enabling substantial current flow under reverse bias.
Key Characteristics of Zener Diodes
- A Zener diode is a properly doped p-n junction diode characterized by a sharp breakdown voltage.
- It is permanently operated in the reverse-biased condition for voltage regulation tasks.
- The sharp breakdown voltage is denoted as .
- It is not immediately destroyed upon entering the breakdown region, provided the power dissipation remains within safe manufacturer limits.
I-V Characteristics of a Zener Diode
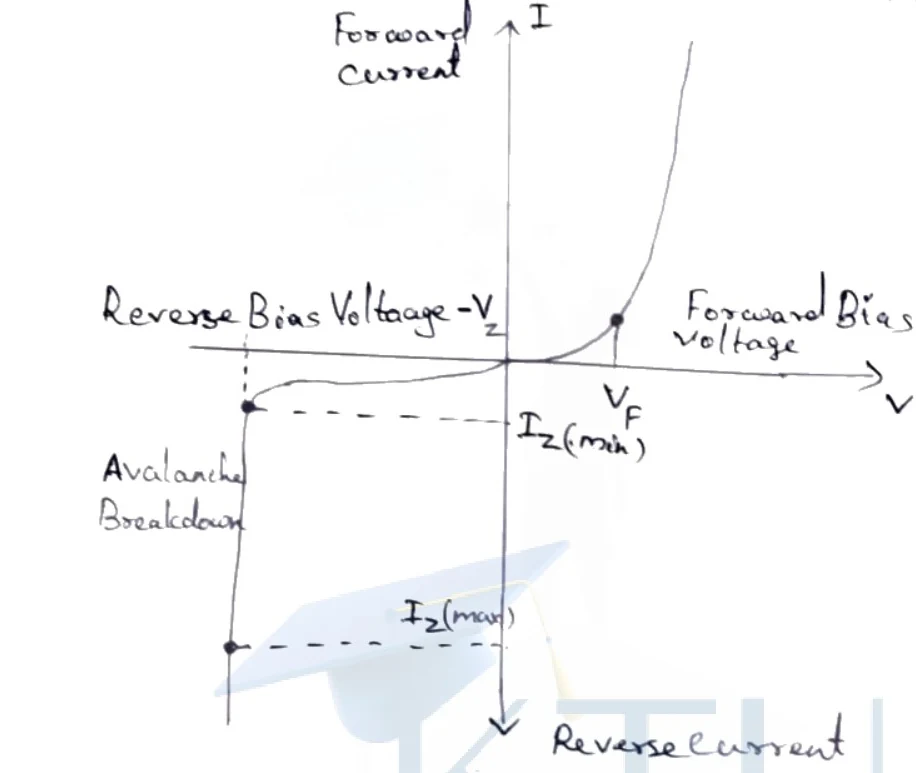
Figure: I-V characteristics of a Zener diode
I-V characteristics curve of a Zener diode plotted on orthogonal axes with Voltage V on the horizontal axis and Current I on the vertical axis. The vertical axis has 'Forward current' pointing upwards and 'Reverse current' pointing downwards. The horizontal axis has 'Reverse Bias Voltage -V' on the left and 'Forward Bias voltage' on the right. In the first quadrant, the curve shows forward bias characteristics rising exponentially after the forward voltage VF. In the third quadrant, the curve shows reverse bias characteristics starting with a small reverse saturation current, reaching a knee point marked with Iz(min), followed by a sharp vertical drop labelled 'Avalanche Breakdown', and extending down to a point marked Iz(max).
I-V characteristics of a Zener diode
The current-voltage (-) characteristics curve is plotted with voltage along the horizontal axis and current along the vertical axis.
- In the first quadrant (forward bias), the curve closely mimics a regular diode where current rises exponentially after the knee voltage.
- In the third quadrant (reverse bias), only a negligible reverse saturation current flows until the magnitude of the reverse voltage reaches . At this point, the curve drops vertically downward, showing a massive increase in reverse current for virtually no change in reverse voltage. This constant-voltage region is exploited for voltage regulation and wave-shaping applications.
Applications of Zener Diode:
- Used as a voltage regulator to maintain a steady DC output voltage despite input supply fluctuations.
- Used for over-voltage protection of sensitive electronic circuits.
- Used in clipping and clamping circuits to shape waveforms.
Comparison: p-n Junction Diode vs. Zener Diode
| Zener Diode | p-n Junction Diode |
|---|---|
| 1. Current can flow in both forward and reverse-biased conditions (during breakdown). | 1. Current is permitted to pass only in the forward-biased condition. |
| 2. Fabricated with heavy doping. | 2. Fabricated with low or moderate doping. |
| 3. Operating in reverse breakdown does not harm the diode. | 3. High reverse current can permanently damage or destroy the junction. |
| 4. Breakdown occurs at a lower, precisely controlled voltage. | 5. Breakdown occurs at a significantly higher, uncontrolled voltage. |
| 5. Does not follow Ohm's law in the breakdown region. | 5. Follows Ohm's law in its linear operating regions. |
Comparison: Zener Breakdown vs. Avalanche Breakdown
| Property | Zener Breakdown | Avalanche Breakdown |
|---|---|---|
| 1. Breakdown Voltage () | Observed in diodes with low breakdown voltages (). | Observed in diodes with higher breakdown voltages (). |
| 2. Physical Mechanism | Valence electrons are pulled directly into the conduction band by the intense electric field. | Valence electrons are knocked into the conduction band by collision impact with thermally accelerated free carriers. |
| 3. Temperature Coefficient | The breakdown voltage decreases as temperature increases. | The breakdown voltage increases as temperature increases. |
| 4. Sharpness of Curve | The - characteristic curve exhibits an extremely sharp knee. | The - characteristic curve is less sharp and more rounded. |
| 5. Depletion Region | Extremely thin depletion region (). | Relatively thick depletion region. |
| 6. Doping Concentration | Doping concentration is very high. | Doping concentration is low or moderate. |
| 7. Primary Cause | High electric field across the junction. | Carrier collision and impact ionization. |
| 8. Carrier Generation | Direct field-emission of electrons. | Generation of cumulative electron-hole pairs via impact. |
Tunnel Diodes and Negative Resistance
Building upon the heavy doping concepts explored in Zener diodes, extreme doping leads to quantum mechanical tunneling at very low forward voltages. This section covers the principles, VI characteristics, and applications of tunnel diodes.
Introduction to Tunnel Diode
A tunnel diode is a heavily doped p-n junction diode that exhibits a negative resistance region in its forward-biased condition. Due to heavy doping, the depletion region becomes extremely thin (in the order of ). This allows charge carriers to penetrate the potential barrier rather than surmount it, a quantum mechanical phenomenon known as tunneling.

Figure: Tunnel diode symbol
Tunnel diode symbol. Circuit symbol for a tunnel diode, showing a standard diode symbol with a horizontal bar across the top of the cathode bar, and a vertical line through the center representing the leads, with the label "Tunnel diode Symbol" beside it.
Tunnel diode symbol. Circuit symbol for a tunnel diode, showing a standard diode symbol with a horizontal bar across the top of the cathode bar, and a vertical line through the center representing the leads, with the label "Tunnel diode Symbol" beside it.
Working Principle and Tunnelling Effect
In a heavily doped p-n junction:
- There is a large concentration of majority carriers in both the p and n regions.
- The large number of carriers creates high drift activity, raising the energy levels of many valence electrons closer to the conduction band.
- Only a very small forward bias voltage is required to initiate conduction.
- The movement of valence electrons directly from the valence band to the conduction band with minimal forward bias is called tunneling.
VI Characteristics of a Tunnel Diode
The current-voltage (VI) characteristics of a tunnel diode display distinct operational regions as the forward voltage is increased:
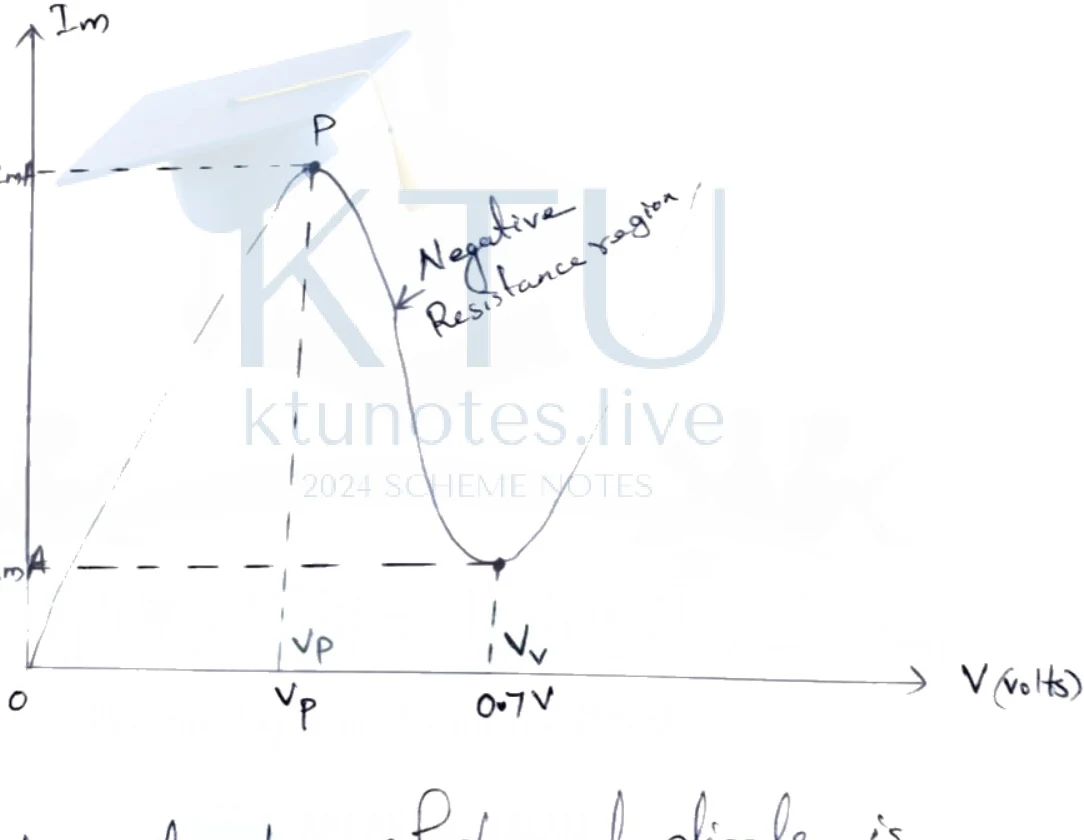
Figure: VI characteristics of a Tunnel Diode graph
VI characteristics graph of a tunnel diode. The vertical axis is labeled I_m (current) and the horizontal axis is labeled V (volts). The origin is labeled O. The curve starts at the origin, rises to a peak point P with peak current I_p = 2.2 mA and peak voltage V_p on the x-axis. From point P, the curve decreases in a region labeled "Negative Resistance region" to a valley point with valley current I_v = 0.3 mA and valley voltage V_v = 0.7 V on the x-axis, after which the current rises again. Dashed lines connect the peak and valley points to their respective axis values.
VI characteristics graph of a tunnel diode. The vertical axis is labeled (current) and the horizontal axis is labeled (volts). The origin is labeled . The curve starts at the origin, rises to a peak point with peak current and peak voltage on the x-axis. From point , the curve decreases in a region labeled "Negative Resistance region" to a valley point.
-
Forward Tunneling Region (Up to Peak Point ): Initially, as the forward bias voltage increases, electrons from the n-region tunnel through the ultra-thin potential barrier to the p-region. The diode current increases rapidly until it reaches the peak point , characterized by peak voltage and peak current .
-
Negative Resistance Region (Between Peak Point and Valley Point ): When the voltage is increased beyond , the quantum mechanical tunneling action abruptly decreases. Consequently, the diode current decreases as the forward voltage increases, defining the negative resistance region (). This continues until the valley point, characterized by valley voltage and valley current .
-
Normal Diode Region (Beyond Valley Point): When the forward voltage is increased beyond the valley point voltage, the tunnel diode behaves like a standard p-n junction diode. The conventional diffusion current dominates, and current increases with increasing forward voltage, exhibiting positive resistance once again.
Applications of Tunnel Diodes
- Ultra-High-Speed Switches: Due to the near-instantaneous nature of quantum mechanical tunneling, tunnel diodes operate at extreme speeds.
- Oscillators: The negative resistance region allows the device to compensate for circuit losses, making it ideal for high-frequency relaxation oscillators.
- Logic Memory Storage Devices: Utilized in fast digital switching and storage applications.
- Satellite Communication: Employed in high-frequency microwave amplifiers and communication circuits.
Photodetectors: Junction and PIN Photodiodes
Transitioning from internal diode voltage manipulation, we now examine devices that interact with external optical light signals. Photodetectors are essential components at the receiving end of optical communication links, designed to convert incoming light signals into readable electrical voltages or currents.
1. Fundamentals of Photonics and Photodetectors
Photonics is the branch of science and technology that deals with the generation, control, and detection of photons, combining optics, electromagnetism, and quantum mechanics.
A photodetector requires the following key operational characteristics:
- High sensitivity to optical inputs
- High reliability and stability
- Short response time (high switching speed)
- Low bias voltage operation
- High electrical response
Common examples include photodiodes and phototransistors. The standard circuit symbol for a photodiode features a conventional diode symbol enclosed in a circle with two arrows pointing towards the device, indicating incident light.
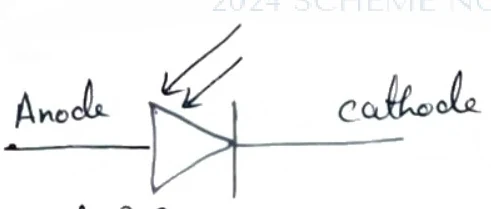
Figure: Photodiode symbol
Circuit symbol of a photodiode showing a diode symbol with two arrows pointing towards the diode. The left terminal is labelled 'Anode' and the right terminal is labelled 'cathode'.
2. Junction Photodiode
A junction photodiode is a reverse-biased p-n junction embedded in a clear plastic medium where the current varies linearly with incident light flux.
Construction and Working Principle
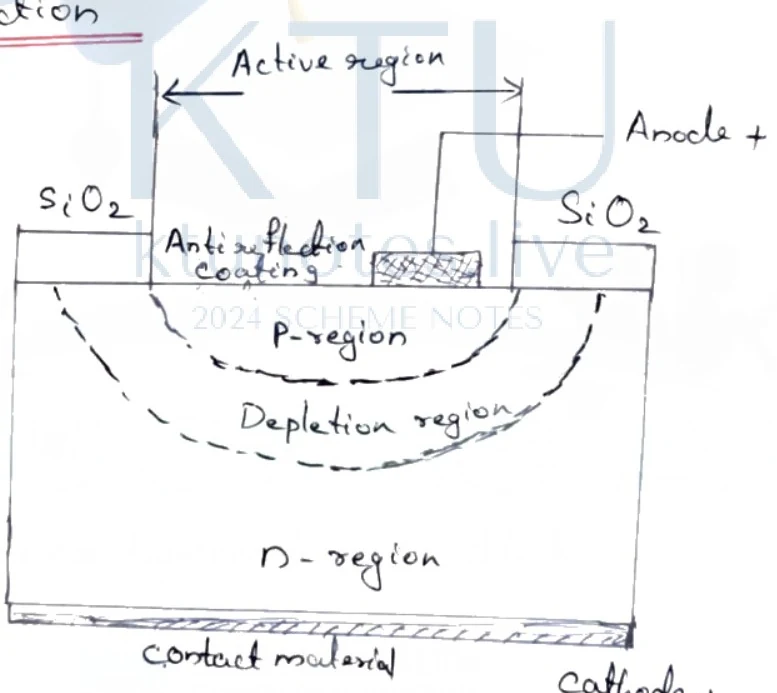
Figure: Construction diagram of a junction photodiode
Construction cross-sectional diagram of a junction photodiode. Labels include: 'Active region' with a double-ended arrow across the top window; 'Anode +' connected to the top contact; 'SiO2' layers on the left and right top surfaces; 'Anti-reflection coating' in the middle top window above a hatched contact area; 'P-region' below the coating; 'Depletion region' bounded by dashed curved lines; 'n-region' occupying the bulk below; 'contact material' at the very bottom; and 'cathode +' connected to the bottom contact material.
The junction photodiode is formed by diffusing a lightly doped p-region into a heavily doped n-region. The front surface contains an active area coated with an anti-reflection coating to maximize light entry, while the remaining non-active area is coated with a thick layer of silicon dioxide (). Adjusting the non-active thickness helps tailor the spectral response and speed.
When connected in a reverse-biased configuration with a low reverse voltage, a small constant current flows through the device even in complete darkness. This is the dark current (or leakage current), caused by thermally generated minority carriers (electrons in the p-type, holes in the n-type) swept across the depletion region by the electric field:
Where:
- = Dark current (A)
- = Reverse saturation current (A)
When photons of sufficient energy () are absorbed by the semiconductor materials, valence band electrons are excited into the conduction band, generating electron-hole pairs called photocarriers. Under the reverse bias field, these sweep across the junction to create a photocurrent () that adds directly to the dark current in the external circuit:
To maximize sensitivity, the dark current must be minimized, and the depletion region width optimized to absorb maximum optical power.
3. PIN Photodiode
To overcome the speed and absorption limitations of standard p-n junction photodiodes, the PIN photodiode inserts a wide, lightly-doped intrinsic (I) region between heavily doped p-type and n-type semiconductor layers.
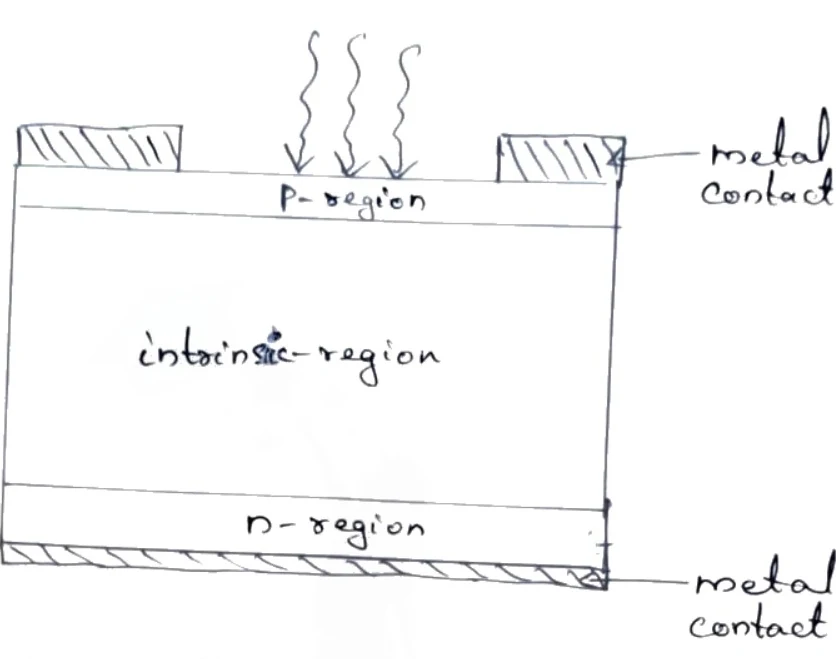
Figure: Structure of a PIN Diode
Cross-sectional diagram of a PIN diode. At the top, a P-region features hatched metal contacts on the left and right sides. Three downward-pointing wavy arrows indicate incident radiation entering the P-region from above. Below the P-region lies a wide intrinsic region labeled 'intrinsic-region'. Below that is an n-region with a hatched metal contact spanning the entire bottom surface. Labels point to 'metal contact' on the top right, 'P-region' in the upper layer, 'intrinsic-region' in the middle layer, 'n-region' in the bottom layer, and 'metal contact' at the bottom right.
Construction and Performance Advantage
- p-region and n-region: Heavily doped layers to provide ohmic contacts.
- Intrinsic (I) region: A thick, undoped semiconductor layer sandwiched between p and n regions.
When a reverse bias voltage is applied, the depletion region expands completely across the entire intrinsic region. Because the intrinsic layer is much wider than a normal depletion width, it absorbs a significantly larger fraction of incoming photons deep within the space charge region.
This broad space charge region results in:
- Higher Quantum Efficiency: More electron-hole pairs generated per incident photon.
- Faster Response Time: High electric field across the intrinsic region sweeps carriers out rapidly, reducing transit time.
- Lower Junction Capacitance: Wide separation between p and n plates () cuts capacitance, enabling high-frequency microwave and gigabit optical fiber communications.
Solar Cells and Panel Stringing
Solar cells are solid-state semiconductor devices that directly convert solar radiation into electrical energy through the photovoltaic effect. Unlike conventional photodiodes that operate under a reverse bias voltage to detect light signals, solar cells operate under zero external bias as large-area junctions designed for power generation.
Construction and Photovoltaic Principle
A solar cell consists of a heavily doped p-n junction with a large surface area to maximize light absorption. The top n-type layer is made extremely thin so that incident photons can easily penetrate the depletion region. An antireflection coating is applied on the topmost surface to minimize optical reflection losses, accompanied by metallic grid contacts to collect the generated charge carriers without blocking incoming sunlight. The bottom contact covers the p-type layer.
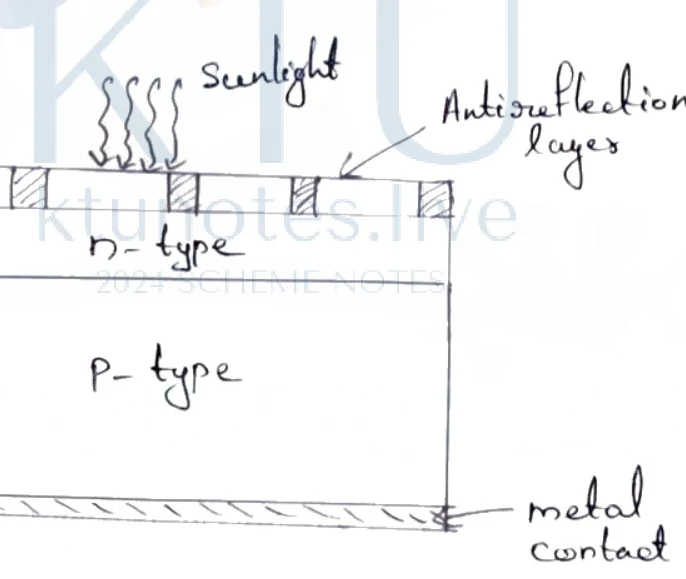
Figure: Solar cell diagram
Solar cell cross-section diagram showing an upper n-type semiconductor layer with striped metal fingers and an antireflection layer on top. Sunlight is indicated by wavy downward arrows labelled 'Sunlight'. Below the n-type layer is a thicker p-type layer. At the bottom of the p-type layer is a hatched metal contact strip labelled 'metal contact'. A label points to the top antireflection layer with the text 'Antireflection layer'.
When sunlight strikes the semiconductor wafer, photons with energy greater than or equal to the band gap energy () excite valence band electrons into the conduction band, creating electron-hole pairs. The built-in electric field of the p-n junction sweeps the photogenerated electrons toward the n-type region and holes toward the p-type region. When an external load is connected, these charge carriers flow through the circuit, generating a usable electric current.
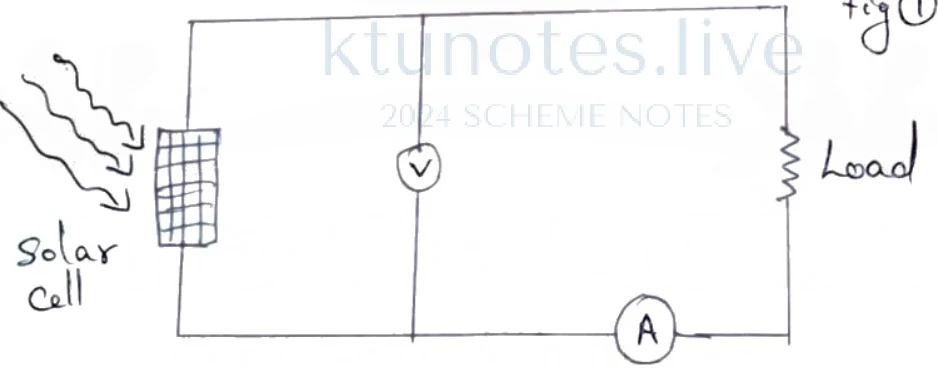
Figure: Circuit diagram of a solar cell with voltmeter, ammeter, and load resistance
Circuit diagram of a solar cell with voltmeter, ammeter, and load resistance. A solar cell is shown on the left receiving sunlight (represented by wavy arrows). It is connected in a closed loop circuit containing a voltmeter (V) in parallel, an ammeter (A) in series, and a Load resistor on the right side.
I-V Characteristics and Power Output
The electrical performance of a solar cell is evaluated using its current-voltage (-) characteristics curve.
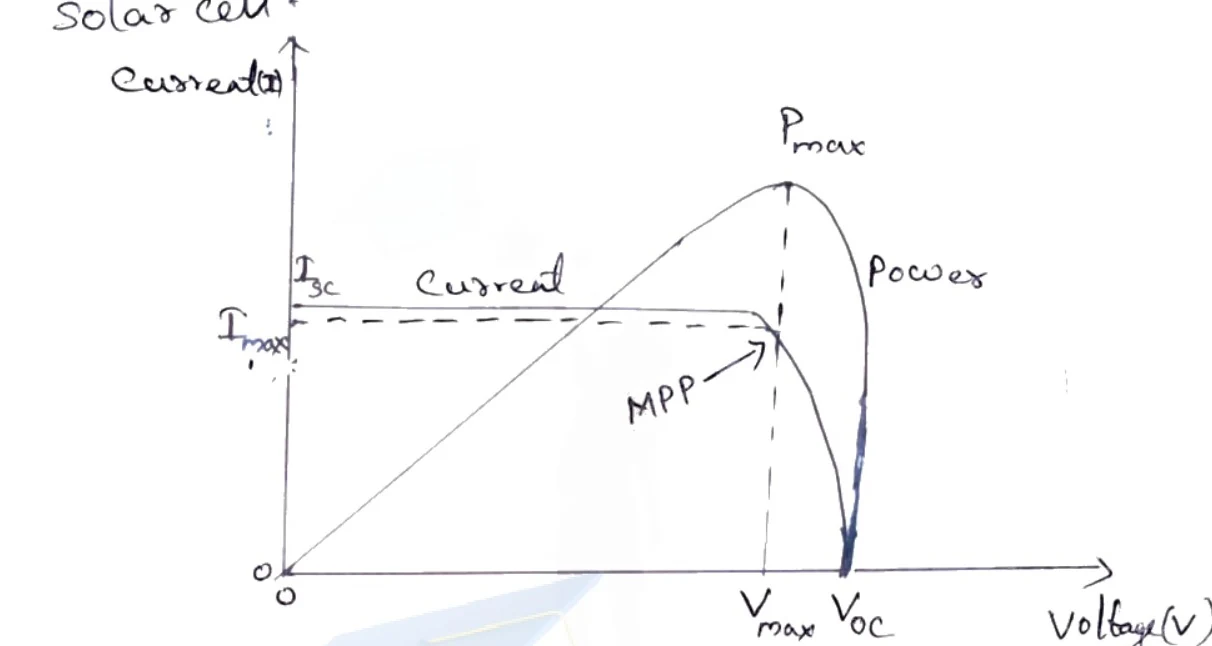
Figure: I-V curve and power output of a solar cell
Graph showing the I-V curve and power output of a solar cell. The vertical axis represents Current (I) with an origin O, and the horizontal axis represents Voltage (V) with an origin O. A horizontal dashed line represents the current, starting at Isc on the y-axis and dropping slightly to Imax. The I-V curve is approximately flat near Isc and drops steeply to Voc on the voltage axis. The power curve starts at the origin (0,0), rises to a peak labeled Pmax corresponding to voltage Vmax, and drops back to zero at Voc.
Key parameters derived from the - curve include:
- Short-Circuit Current (): The maximum current produced by the solar cell when the output terminals are shorted ().
- Open-Circuit Voltage (): The maximum voltage available from the solar cell when the terminals are open (). A typical single silicon solar cell produces an open-circuit voltage of approximately .
- Maximum Power Point (): The operating point on the - curve where the product of voltage and current reaches its maximum value (). The load resistance must be chosen precisely to match this operating condition.
Efficiency and Fill Factor
The conversion efficiency () of a solar cell is defined as the ratio of maximum electric power output to the total incident optical power from the sun:
The Fill Factor () measures the squareness of the - curve and represents the fraction of the theoretical maximum power () actually delivered at the maximum power point: Typical high-performance solar cells possess a fill factor ranging between and .
Series and Parallel Solar Panel Stringing
To scale up the voltage or current to practical levels, multiple solar cells are interconnected to form solar panels.
Series Stringing
Connecting the positive terminal of one solar cell to the negative terminal of the next increases the total output voltage while keeping the current constant. For identical cells connected in series, the total open-circuit voltage is multiplied by :
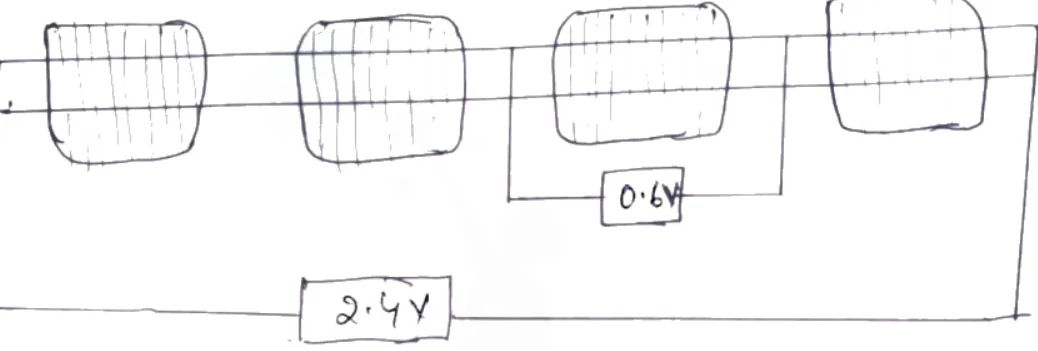
Figure: Diagram showing solar cells connected in series/parallel combination with voltage readings
Hand-drawn circuit diagram showing four solar cells arranged horizontally in a row. The cells are connected by lines representing electrical connections. A smaller box below two adjacent cells shows a voltage of 0.6V, and a larger box spanning across the bottom of the entire four-cell assembly shows a voltage of 2.4V.
Parallel Stringing
Connecting all positive terminals together and all negative terminals together maintains a constant voltage output while scaling up the total current linearly with the number of cells:
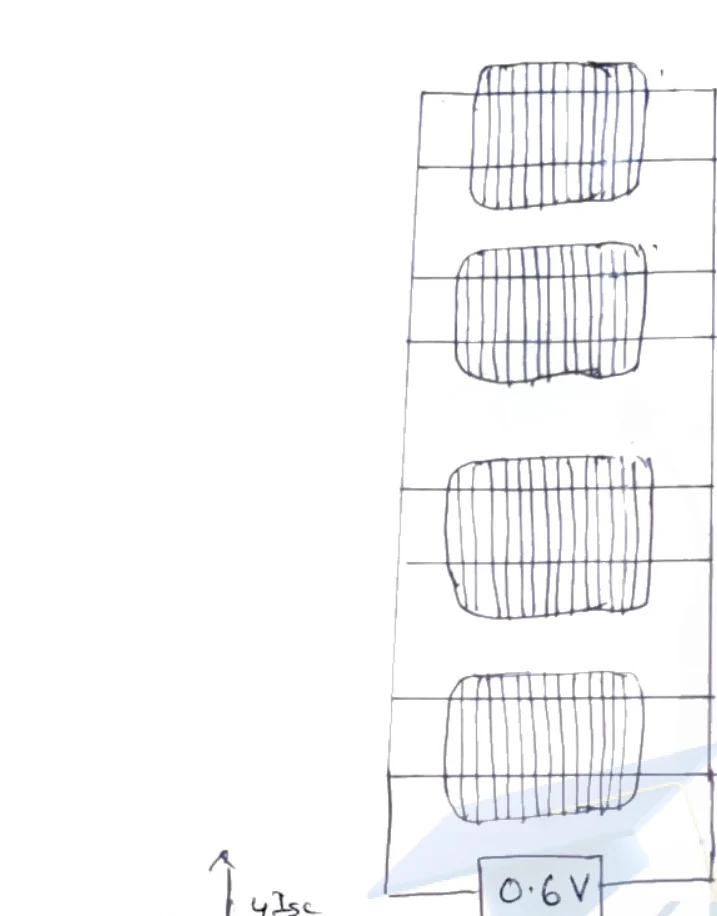
Figure: Four solar cells connected in parallel with a voltage of 0.6V
Hand-drawn schematic diagram showing four rectangular solar cells stacked vertically, connected in parallel. A voltage value of 0.6 V is indicated in a box connected across the parallel configuration.
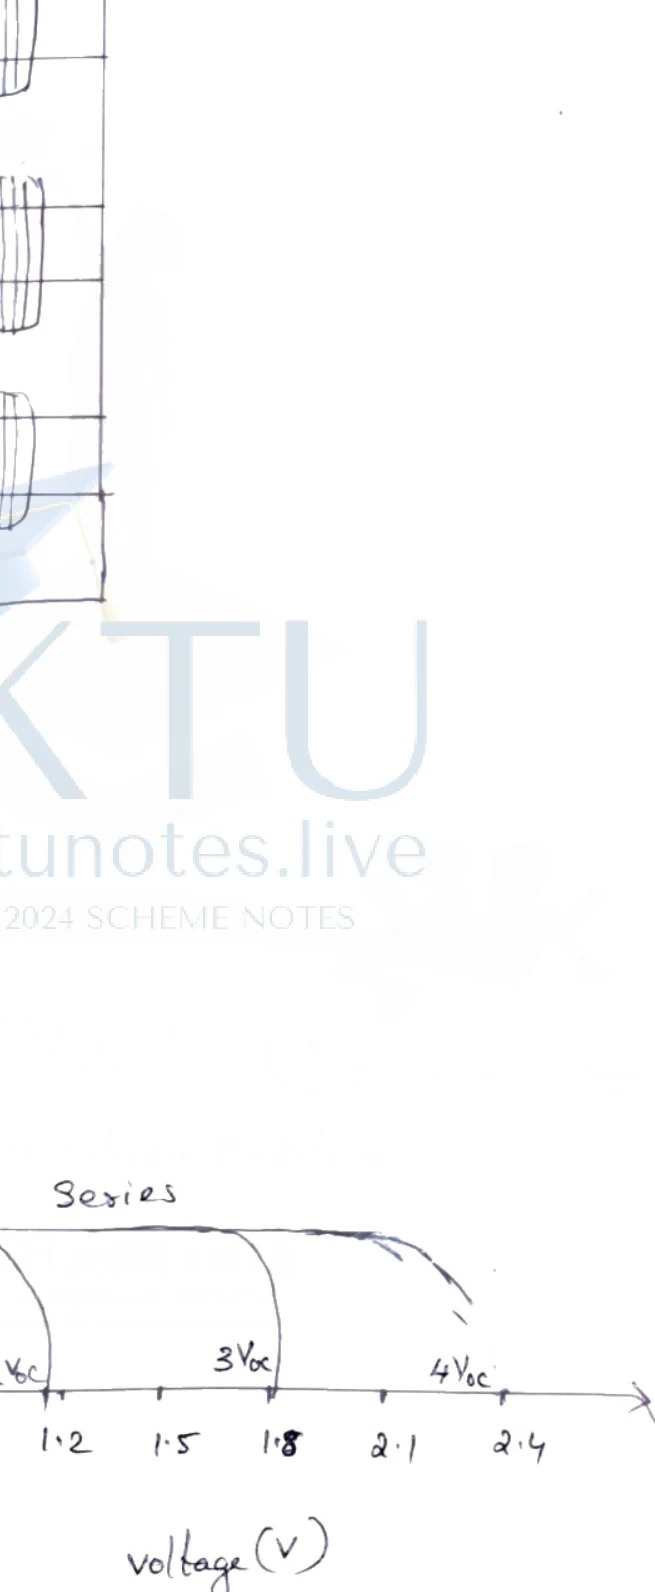
Figure: Current vs Voltage characteristics for series and parallel solar cell configurations
Hand-drawn graph of Current (A) on the y-axis versus voltage (V) on the x-axis, illustrating the I-V characteristics for series and parallel configurations of solar cells. The y-axis has numerical markings from 1 to 12, with specific labels at Isc (3), 2Isc (6), 3Isc (9), and 4Isc (12). The x-axis has numerical markings 0.3, 0.6 (labelled Voc), 0.9, 1.2 (labelled 2Voc), 1.5, 1.8 (labelled 3Voc), 2.1, and 2.4 (labelled 4Voc). Curves for parallel connection are stacked vertically near 0.6V reaching currents up to 4Isc. Curves for series connection are shown extending horizontally at a current of 3 with voltage intercepts at Voc, 2Voc, 3Voc, and 4Voc.
Light Emitting Diodes (LEDs)
Introduction and Working Principle
A Light Emitting Diode (LED) is a heavily doped p-n junction diode that emits spontaneous radiation when it is forward-biased. While conventional diodes convert electrical energy into heat and standard reverse-biased photodiodes convert light into electrical energy, an LED performs the direct reverse of a photodiode: it converts electrical energy directly into optical radiation through a process called electroluminescence.
When the p-n junction is forward-biased by an external DC voltage source, the potential barrier at the junction is significantly reduced. This allows electrons from the n-region to cross over into the p-region, and holes from the p-region to cross over into the n-region. As these minority carriers drift across the junction, they recombine with majority carriers. During this electron-hole recombination event, the relaxing electrons fall from the conduction band to the valence band, releasing their excess energy. In direct band gap semiconductors, this energy is released primarily in the form of photons (light quanta) rather than heat.
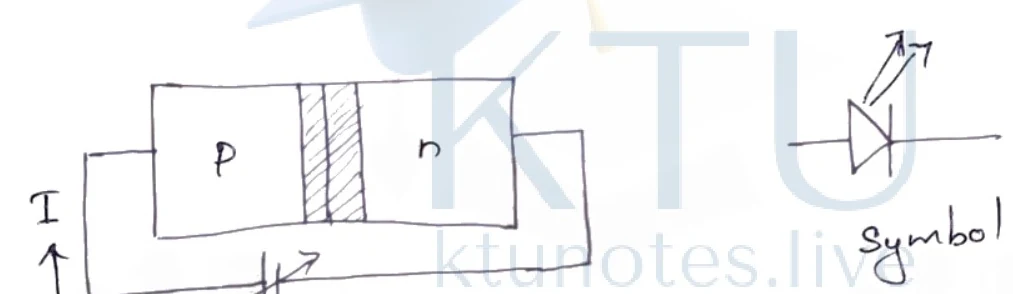
Figure: LED structure and circuit symbol
LED structure and circuit symbol. A diagram showing the structure of an LED with a p-type region, a depleted/recombination region with vertical hatching, and an n-type region. Wires connect the p and n regions to a DC voltage source labeled V with current I indicated by an arrow. To the right is the circuit symbol for an LED, which is a standard diode symbol inside a circle with two arrows pointing away from it, labeled symbol.
Figure: LED structure and circuit symbol. A diagram showing the structure of an LED with a p-type region, a depleted/recombination region with vertical hatching, and an n-type region. Wires connect the p and n regions to a DC voltage source labeled V with current I indicated by an arrow. To the right is the circuit symbol for an LED, which is a standard diode symbol inside a circle with two arrows pointing outward.
Band Gap Energy and Emitted Wavelength
The energy of the emitted photon is determined directly by the forbidden band gap energy () of the semiconductor material used to fabricate the junction. The relationship governing the wavelength of the emitted light is given by:
Where:
- = Wavelength of the emitted light (m)
- = Planck's constant
- = Velocity of light in free space
- = Semiconductor band gap energy (J or eV)
By varying the chemical composition and doping ratios of ternary or quaternary semiconductor alloys, manufacturers can precisely engineer the band gap , thereby controlling the exact colour of the emitted radiation:
- Gallium Arsenide (GaAs) with emits invisible infrared radiation.
- Gallium Arsenide Phosphide (GaAsP) with emits yellow-red visible radiation.
- Gallium Phosphide (GaP) with emits green radiation.
Important Features and Characteristics
- Point Source: LEDs act effectively as point sources of light, making them easy to focus and align.
- Current Dependency: The light output intensity is a direct function of the forward current flowing through the device. Intensity increases with current until it reaches an optimal maximum before thermal roll-off occurs.
- Switching Speed: Extremely fast response times, typically around .
- Modifiability: The emission wavelength can be tailored by adjusting component percentages during crystal growth.
Applications
- Light sources in high-speed optical fiber communication systems.
- General illumination bulbs for domestic and industrial spaces.
- Status and message displays in mobile phones and digital consumer electronics.
- Outdoor traffic light signaling systems.
- Automotive lighting inside and outside motorcycles and cars.
Advantages
- Significant energy savings and high electrical-to-optical conversion efficiency.
- Low capital and operational costs.
- Low operating voltage and current requirements.
- Low total power output, generally under .
- Very rapid response time () with zero warm-up time or heating delay.
- Miniature physical size, highly compact and lightweight.
- Exceptionally long operating lifespan exceeding 10 years.
- Mechanically rugged construction capable of withstanding severe physical shock and mechanical vibrations.
Disadvantages
- Highly sensitive to electrical overstress; even a slight unintended excess in forward voltage or driving current can permanently destroy the device.
- Optical conversion efficiency decreases as the operating forward current increases due to internal heating effects.